Overall Equipment Effectiveness (OEE) is the gold standard metric for measuring manufacturing productivity — and in FMCG production, it is the single most important number on the plant floor. Whether you run a high-speed beverage bottling line, a snack food packaging facility, or a personal care goods operation, OEE for FMCG tells you exactly how much of your planned production time is truly productive. Yet despite its universal adoption, most FMCG manufacturers still calculate OEE incorrectly, benchmark against the wrong peers, or lack the real-time visibility to act on it. This guide covers OEE calculation for food manufacturing, industry benchmarks, the hidden losses that drag FMCG lines below world-class, and how AI-driven platforms are now closing the gap between measured OEE and maximum throughput.
Deploy a Real-Time OEE Platform for Your FMCG Analytics Team
iFactory's OEE platform delivers automated PLC data capture, micro-stop detection, and AI-driven loss categorisation — purpose-built for high-speed food and beverage plant performance.
What Is OEE and Why Does It Matter for FMCG?
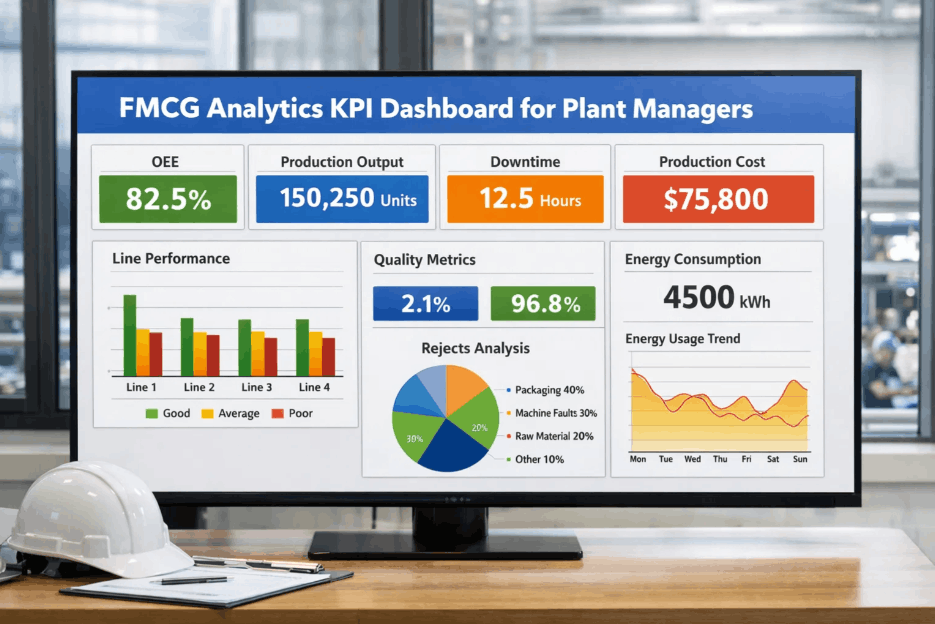
OEE — Overall Equipment Effectiveness — is a composite metric that multiplies three factors: Availability (the percentage of scheduled time the machine is actually running), Performance (how fast the machine runs relative to its theoretical maximum speed), and Quality (the proportion of output that meets specification on the first pass). The resulting OEE percentage is a brutally honest reflection of true production efficiency. In FMCG manufacturing — food, beverage, personal care, and household goods — OEE carries outsized importance because of three defining characteristics of the sector: razor-thin margins, high-speed continuous production, and strict regulatory quality requirements. A line running at 65% OEE when the world-class benchmark is 85% represents tens of crores of rupees in unrealised output annually. Understanding how to book a demo and see OEE live on your own lines is the first step toward closing that gap.
OEE Calculation for FMCG Production Lines
The standard OEE calculation formula multiplies Availability, Performance, and Quality to provide a holistic productivity score. For FMCG food manufacturing, book a demo to see how accuracy requires capturing micro-stops under 30 seconds and properly categorising CIP time to avoid masking true costs.
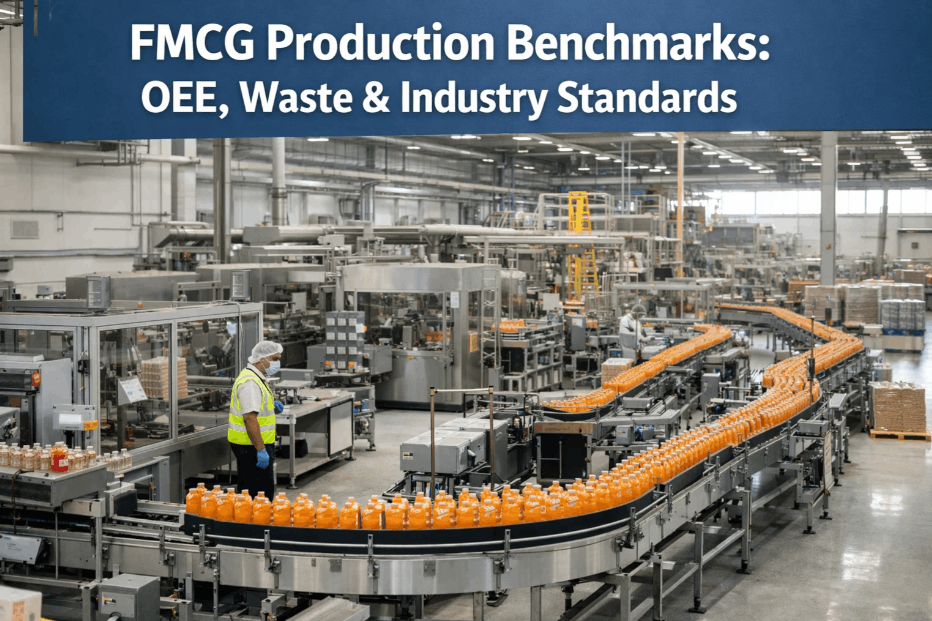
FMCG OEE Benchmarks by Subsector
Benchmarks vary significantly by product category and line speed. Comparing a dairy filling line to a dry snack line without context is misleading, as demonstrated by the realistic FMCG benchmark ranges below drawn from multi-site deployments across the region.
| FMCG Subsector | Typical OEE Range | World-Class Target | Primary Loss Category |
|---|---|---|---|
| Beverage Bottling / Filling | 62% – 74% | 82%+ | Availability (changeovers, CIP) |
| Snack Food Packaging | 58% – 70% | 78%+ | Performance (micro-stops, film jams) |
| Personal Care / HPC | 65% – 78% | 85%+ | Quality (fill weight variation) |
| Dairy / Aseptic Filling | 55% – 68% | 76%+ | Availability (planned sanitation) |
| Confectionery | 60% – 73% | 80%+ | Performance (speed losses) |
| Household Goods | 66% – 76% | 84%+ | Quality (leak / fill rejection) |
The Six Big Losses in FMCG OEE Analysis
The Six Big Losses framework maps every form of OEE loss to Availability, Performance, or Quality. In FMCG production, book a demo to understand how the specific expressions of each loss differ from discrete manufacturing.
Unplanned stoppages from mechanical or electrical failures such as cartoner servo failures or filler valve seizures. Often the most visible but not always the largest loss.
SKU format changes and CIP/sanitation cycles. CIP alone can consume 15–25% of available shift time in dairy and beverage facilities.
Product jams and sensor faults under 5 minutes. Cumulative micro-stops often represent 30+ minutes of lost time that manual reports miss.
Running below rated line speed due to mechanical wear or operator caution, often causing a silent 10-20% Performance hit.
Out-of-spec products during stable production like fill weight deviations or seal failures, resulting in significant material scrap costs.
Yield losses during post-changeover stabilisation. Systematic reduction of startup scrap is a major opportunity for Quality OEE improvement.
Proven OEE Improvement Strategies for FMCG Plants
Improving OEE in food production requires a hierarchy of interventions focused on high line speeds, strict sanitation requirements, and high SKU complexity. Book a demo to discuss your specific line challenges.
Install automated data capture before starting initiatives. Manual logs systematically underreport micro-stops and speed losses that are the primary drivers of FMCG waste.
Apply Pareto analysis to loss data by equipment and SKU. In most plants, 20% of machines contribute 80% of Availability losses and changeover downtime.
Focus on eliminating invisible stops under 5 minutes. RCA of recurring micro-stop patterns typically recovers 8–12 OEE percentage points within 90 days.
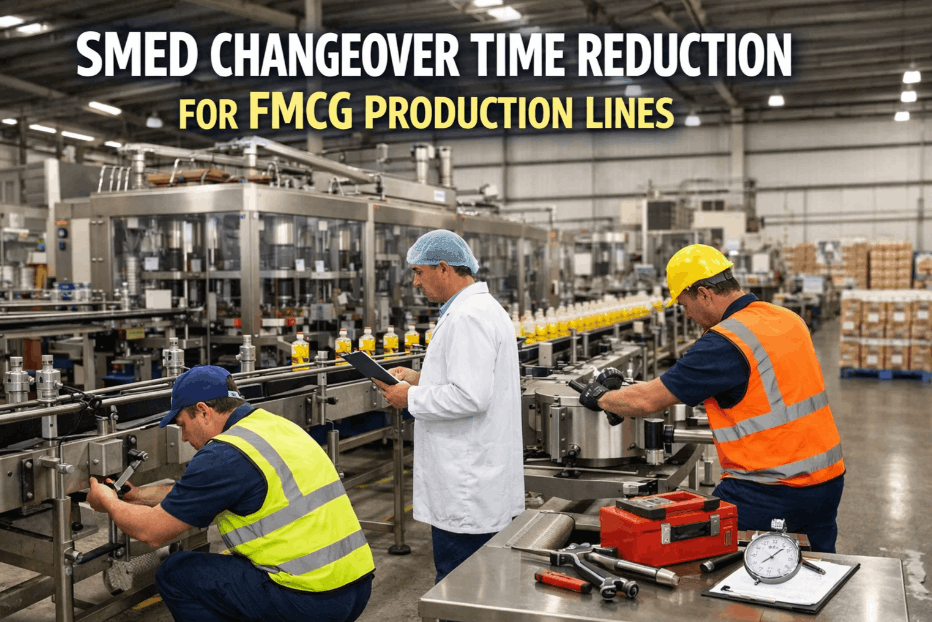
Standardise external elements and changeover parts staging. Professional SMED application routinely reduces FMCG changeover time by 30–50%.
Deploy condition monitoring on line bottlenecks. Converting unplanned failures into planned maintenance during sanitation windows protects OEE stability.
OEE Software for Food & FMCG Manufacturing: What to Look For
Purpose-built OEE software must detect micro-stops via PLC integration, automate loss categorisation via AI mapping, and integrate with SAP PM to close the loop. If you want to see these features in action, you can book a demo today.
Captures every micro-stop and speed deviation without manual intervention — the only reliable way to measure true Performance OEE.
AI-driven mapping of fault codes to the Six Big Losses, capturing the losses that manual reporting misses in high-speed environments.
Auto-creates work orders when OEE-degrading conditions are detected, ensuring objective data triggers maintenance response.
Frequently Asked Questions: OEE for FMCG Manufacturing
What is a good OEE score for an FMCG food manufacturing plant?
World-class is 85%, but 75-82% is realistic for high-speed lines in Asia due to sanitation cycles. Focus on improvement trajectory from your baseline over 12-24 months.
How do you calculate OEE for a filling line with multiple changeovers?
Use total shift time minus scheduled breaks. Track changeovers as Availability loss individually at the SKU level to enable specific SMED analysis and improvement.
Should CIP and sanitation time be included in OEE calculation?
It is best to include CIP in Planned Production Time as a planned Availability loss. This preserves OEE as a running metric while providing total time utilisation visibility.
What is the fastest way to improve OEE in FMCG packaging?
Focus on automated micro-stop detection and root-cause elimination. Recover 8–15 OEE points through mechanical corrections. Book a demo to accelerate this for your line.
Can OEE software integrate with our existing SAP or ERP system?
Yes, iFactory offers native SAP PM integration. It auto-creates work orders when OEE-degrading conditions are detected, closing the loop between data and action.