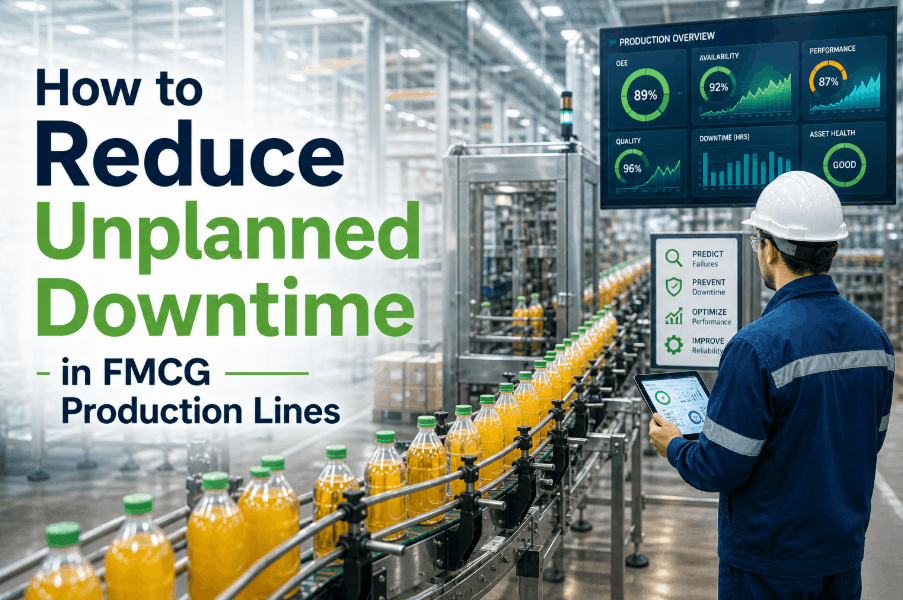
For FMCG plant managers and operations directors, the cost of a single hour of unplanned downtime on a high-speed production line is staggering — typically ranging from $10,000 to $65,000 when accounting for lost throughput, labor idle time, and batch spoilage. Whether it is a filler valve failure on a carbonated beverage line or a labeling machine jamming during a peak carton run, the pattern is the same: reactive maintenance replaces productive action, and the financial impact compounds. Modern **FMCG downtime reduction** strategies no longer rely on guesswork or calendar-based schedules; they leverage AI-driven predictive analytics to flag equipment health degradation weeks before a catastrophic failure occurs. If you are ready to eliminate these blind spots and maximize your line efficiency, you can schedule a demo or talk to our engineers to run a custom OEE impact analysis for your facility.
Cut Unplanned Downtime by 35% in 90 Days
Our AI platform detects mechanical and electrical anomalies in FMCG assets weeks before they trigger an E-stop.
The Hidden Variables That Understate FMCG Downtime Costs
Most food and beverage manufacturers track "cost of repair," but few capture the "true cost of failure." A comprehensive **downtime impact model for FMCG** must include variables that finance teams often miss. When a rotary filler fails, you aren't just paying for a pump seal and a technician; you are paying for the 4,000 units that weren't bottled, the electricity used to run sterile systems that are now idling, and the supply chain penalties for late retail delivery. To see how these variables map to your actual line performance, book a demo today.
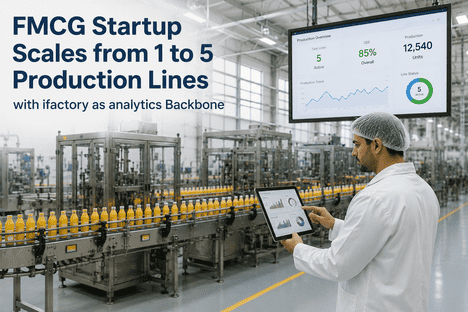
In high-speed FMCG, every minute counts. At 600 units per minute, a 20-minute stoppage equates to 12,000 units of lost revenue. PdM identifies mechanical drag in conveyors and fillers that silently degrades line speed before causing a total halt.
Unplanned failures often occur immediately after Clean-In-Place (CIP) cycles due to sensor moisture or thermal stress. AI analytics corridors distinguish between normal sanitation signals and genuine asset health degradation.
Stoppages on lines processing perishables (dairy, beverages, fresh foods) carry 100% loss risk for product currently in the pasteurizer or oven. Predictive warnings allow operators to flush or finish batches before failure occurs.
Missing a retail delivery window due to a production line failure often triggers expedited freight charges or retailer fines. Maintaining machine health is the foundation of a reliable, high-margin supply chain.
Restarting high-inertia equipment (centrifuges, mixers, chillers) triggers significant peak demand charges from utilities. Minimizing restarts through PdM significantly optimizes your plant's energy intensity profile.
The Formula for FMCG Line Resilience
Transitioning from reactive to **predictive maintenance in FMCG** requires a shift in how you calculate maintenance success. Instead of measuring "time to repair," world-class plants measure "time between failures" and "predictive detection accuracy." The iFactory platform maps your historical failure modes to a 3-year savings projection, helping you move from crisis management to strategic OEE optimization. You can talk to our engineers to start your custom benchmarking session.
Downtime Impact Benchmarks: FMCG Manufacturing Segments
While every plant is unique, the ROI profile for **downtime reduction analytics** follows established benchmarks across production categories. High-perishability segments (dairy, frozen) typically see the fastest payback due to the high cost of avoid batch loss events, while high-volume segments (bottling, snacks) gain primarily from line speed optimization. If you'd like to book a demo, we can compare your facility against these segment benchmarks.
| FMCG Segment | Critical Asset Focus | Avg. Downtime Cost/Hr | Payback Timeline | 3-Year ROI Range |
|---|---|---|---|---|
| Beverage & Bottling | Fillers / Labelers | $15,000 – $45,000 | 8–12 Months | 320% – 480% |
| Frozen & Chilled Foods | Compressors / Spiral Freezers | $25,000 – $65,000 | 6–9 Months | 410% – 580% |
| Snacks & Bakeries | Conveyors / Ovens | $8,000 – $22,000 | 12–16 Months | 240% – 360% |
| Dairy Processing | Homogenizers / HTST Systems | $20,000 – $55,000 | 7–11 Months | 350% – 490% |
| Personal Care & Cosmetics | Capping / Packaging lines | $12,000 – $38,000 | 10–14 Months | 280% – 410% |
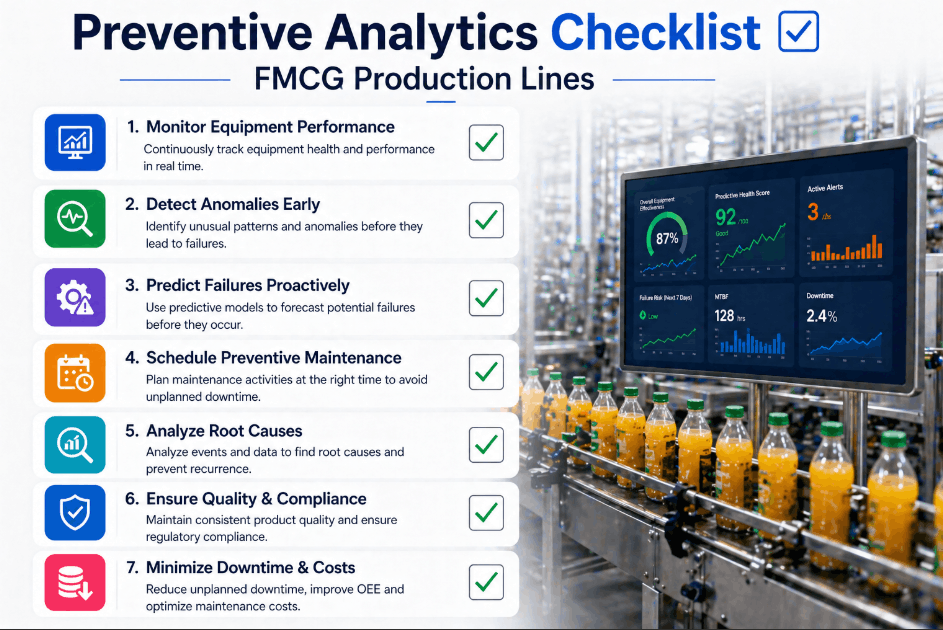
Moving From Reactive to Proactive: The Three Value Pillars
Successful **OEE improvement in FMCG** requires more than just alarms; it requires actionable intelligence that technicians can use without specialized diagnostic training. The iFactory platform is designed to integrate into existing workflows, providing clear "early warning" indicators that trigger planned work orders instead of midnight emergency calls.
High-Frequency Vibration Analysis
Identify imbalance, bearing wear, and shaft misalignment in FMCG pumps and motors up to 6 months before physical symptoms manifest. This provides a clear window for off-peak repair.
Automated Failure Diagnostics
When a health threshold is breached, the AI correlates power draw, temperature, and vibration to pinpoint the specific component failing, reducing mean-time-to-repair (MTTR) by 40%.
Digital Maintenance Audits
Automatically document every health alert and subsequent work order to meet FSMA and ISO22000 requirements. Immutable digital logs eliminate manual paperwork and audit gap risk.
Benchmark Your Plant's Downtime Risk
Our engineers will map your line's failure history and throughput to a 12-month savings projection — at no cost.
Frequently Asked Questions: Downtime Reduction in FMCG
How much can predictive analytics actually reduce unplanned downtime on an FMCG line?
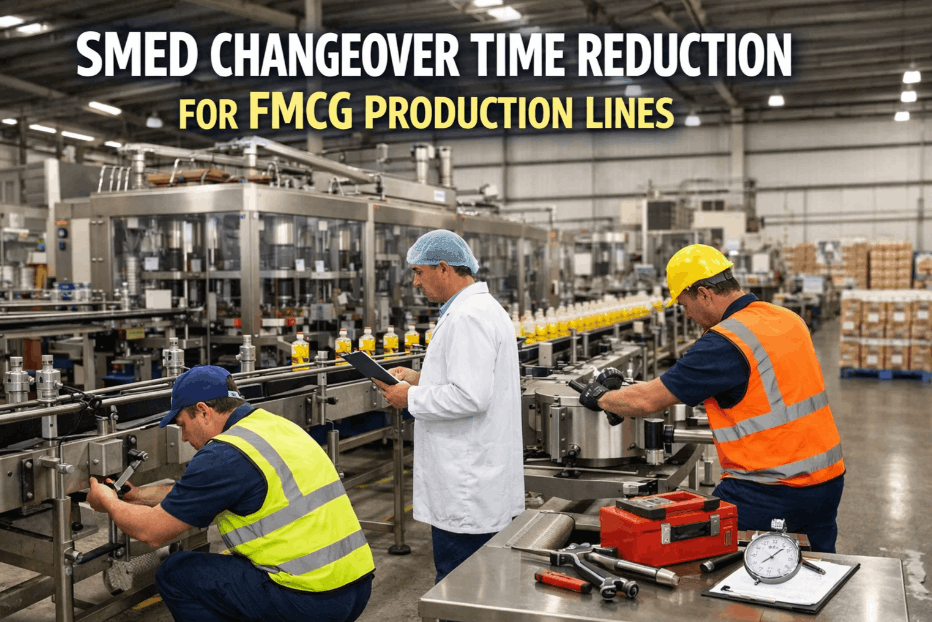
On average, FMCG plants deploying iFactory see a 30% to 52% reduction in unplanned downtime within the first 12 months. This is achieved by converting catastrophic failures into planned maintenance interventions during scheduled changeovers or sanitation windows.
What are the most common causes of unplanned downtime in food manufacturing?
Beyond obvious mechanical failures, the most common causes are component fatigue from high-cycle operations, sensor misalignment during washdowns, and lubrication failures in inaccessible bearing housings. Predictive analytics monitors the environmental and operational stress on these components in real-time.
Does the system require a complex installation on existing FMCG equipment?
No. iFactory uses non-invasive IoT sensors that can be deployed on existing production lines without downtime. The sensors bridge directly to our AI platform via secure cellular or WiFi gateways, requiring zero integration with your plant's legacy PLC or SCADA systems.
How does PdM impact OEE (Overall Equipment Effectiveness)?
PdM directly impacts all three OEE components: Availability (by reducing downtime), Performance (by identifying mechanical drag that slows down lines), and Quality (by detecting equipment vibration that causes batch defects). Most plants see a 5-12 point increase in their base OEE score.
Stop Running to Fail on Your FMCG Lines
Start with a single critical line and see measurable ROI within 90 days. Schedule your facility's impact assessment today.