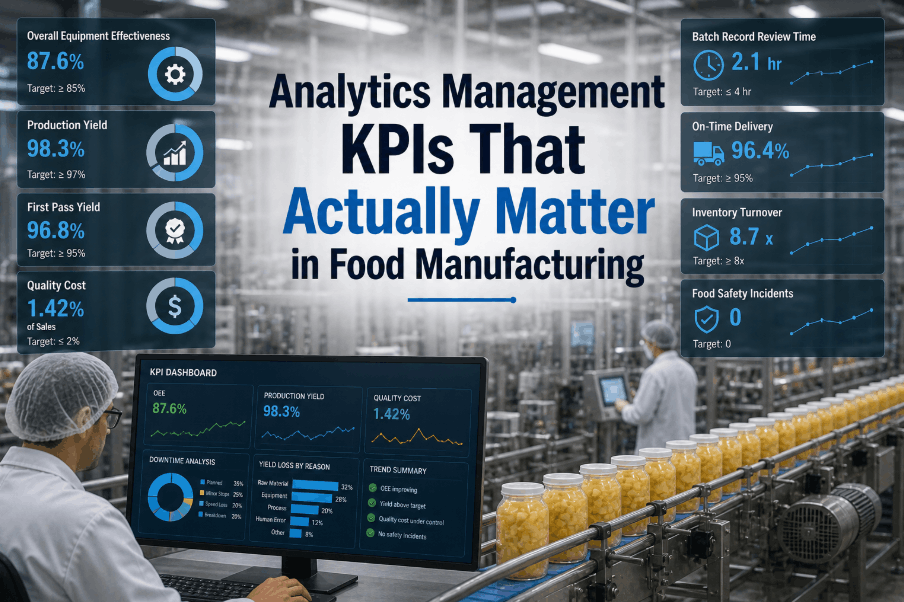
In food manufacturing, the gap between high-performing plants and struggling ones rarely comes down to equipment — it comes down to how well operations teams measure, interpret, and act on maintenance and production data. Analytics management KPIs give engineers and plant managers a quantifiable view of equipment health, workforce efficiency, and operational throughput. Without the right metrics in place, unplanned downtime, excessive maintenance costs, and missed production targets become the norm. Book a Demo to see how iFactory's industrial analytics platform surfaces the KPIs that matter most across your food manufacturing operations — in real time, across every asset and production line.
AI-Powered Analytics for Food Manufacturing KPIs
iFactory delivers a manufacturing KPIs dashboard with live MTBF, MTTR, OEE, and asset performance metrics — purpose-built for food and beverage plants driving operational efficiency and reliability.
Why Maintenance KPIs Are the Foundation of Food Manufacturing Performance
Food manufacturing environments operate under relentless pressure — tight production schedules, perishable raw materials, strict food safety compliance windows, and retailer delivery commitments that leave zero margin for equipment failures. In this context, maintenance performance metrics are not administrative overhead; they are the early warning system that separates reactive firefighting from proactive reliability engineering. When MTBF, MTTR, equipment uptime, and planned maintenance compliance are tracked continuously and surfaced through a centralized manufacturing KPIs dashboard, plant engineers gain the operational visibility needed to make data-driven maintenance decisions before failures halt production lines. Food manufacturers who Book a Demo with iFactory consistently report that shifting from periodic audits to live operational analytics reduces unplanned downtime by double digits within the first operational quarter.
The Eight Analytics Management KPIs Every Food Plant Must Track
Not all KPIs deliver equal value in food manufacturing environments. The metrics that drive real operational improvement are those that connect directly to asset reliability, maintenance resource utilization, and production throughput. The following eight KPIs form the analytical core of any effective maintenance management software deployment in a food and beverage facility — and they are the metrics that food plant engineers consistently cite as the most actionable indicators of operational health.
Mean Time Between Failures (MTBF)
Tracks average operating time between equipment failures. A rising MTBF signals stronger asset reliability and a more effective preventive maintenance program across your production lines.
Mean Time to Repair (MTTR)
Measures how fast your team restores a failed asset to operation. Lower MTTR means faster recovery, less perishable product loss, and reduced unplanned downtime costs per incident.
Overall Equipment Effectiveness (OEE)
Combines availability, performance, and quality into one score. World-class food plants target OEE above 85% — anything below 65% indicates major losses in speed, uptime, or product quality.
Planned Maintenance Compliance Rate
Percentage of scheduled PM tasks completed on time. Plants below 80% are deferring maintenance that will surface as unplanned failures — often during peak production runs.
Downtime Analysis by Cause Category
Categorizes stoppages by root cause — mechanical, operator error, changeover, or shortage. Cause-coded downtime data reveals exactly where to focus reliability improvement efforts for maximum ROI.
Maintenance Cost as Percentage of Replacement Asset Value
Total maintenance spend expressed as a share of asset replacement value. Spending above 5% of RAV typically signals over-reliance on reactive repair — a clear case for predictive maintenance investment.
Asset Uptime Percentage by Production Zone
Tracks available operating time per asset and production zone in real time. Live uptime data enables supervisors to spot reliability trends early and reallocate resources before output targets are missed.
Reactive to Planned Maintenance Work Order Ratio
Compares emergency repairs to planned work orders. Best-in-class food plants keep reactive work below 20% — a higher ratio signals a reliability program that is still primarily responding rather than preventing.
Building a Manufacturing KPIs Dashboard for Food Plant Operations
A manufacturing KPIs dashboard that actually drives operational improvement in a food plant is not a static report generated weekly for management review — it is a live operational tool that maintenance technicians, line supervisors, and plant engineers interact with daily to prioritize work, allocate resources, and identify emerging reliability threats. The technical architecture of an effective KPIs dashboard for food manufacturing must integrate data from CMMS work order systems, SCADA production historians, industrial IoT sensor networks, and ERP inventory systems into a unified analytical layer that surfaces actionable metrics without requiring manual data aggregation. Food plant engineers who want to assess how an integrated operational analytics software deployment would improve their current KPI visibility can Book a Demo to review live dashboard configurations built specifically for food and beverage production environments.
Live Sensor Integration for Continuous Asset Performance Tracking
Pulls live telemetry from vibration sensors, temperature monitors, and flow meters — converting raw equipment signals into reliability metrics that update continuously without manual data entry.
MTBF and MTTR Trend Analysis Across Rolling Time Windows
Rolling 30-, 60-, and 90-day trend lines for MTBF and MTTR separate genuine reliability improvement from statistical noise — giving engineers clear proof that maintenance program changes are working.
Cross-Line and Cross-Facility KPI Benchmarking
Compare OEE, MTBF, and compliance rates across lines or facilities to surface performance gaps and replicate best practices — based on real internal data, not generic industry averages.
KPI Threshold Alerting and Automated Maintenance Work Order Creation
When a KPI breaches a threshold, the platform automatically creates work orders and notifies technicians — closing the gap between detecting a problem and acting on it, without manual intervention.
Predictive Maintenance Software: Connecting KPI Data to Failure Prevention
The highest-value application of maintenance performance metrics in food manufacturing is not historical reporting — it is predictive failure prevention. Predictive maintenance software uses machine learning models trained on historical failure data, combined with live sensor telemetry, to calculate the probability of specific failure modes occurring within defined time windows across individual assets. When these failure probability predictions are surfaced alongside current MTBF and MTTR data in a unified operational analytics software platform, maintenance planners can schedule condition-based interventions during planned production windows rather than responding to unplanned failures during active production campaigns. This shift from time-based preventive maintenance to condition-based predictive maintenance is the most impactful operational change available to food plant maintenance organizations, typically reducing total maintenance costs by 15–25% while simultaneously improving asset uptime and OEE. Plant teams interested in deploying predictive analytics on their highest-criticality assets can Book a Demo to review iFactory's failure prediction model configuration for food processing equipment.
Downtime Analysis Software: Quantifying the True Cost of Equipment Failures
Not all downtime in food manufacturing plants carries equal financial impact. A two-minute filler stoppage during a high-volume ambient product run costs significantly less than a twenty-minute pasteurizer failure on a temperature-sensitive product mid-batch. Downtime analysis software that connects equipment failure events to production plan impact, product waste data, energy cost, and labor overtime calculates the true financial cost of each downtime incident — enabling maintenance investment decisions that prioritize reliability improvements by financial return rather than by failure frequency alone. When downtime cost data is integrated into a manufacturing KPIs dashboard alongside MTBF and MTTR metrics, food plant engineers can make quantitative arguments for predictive maintenance program investments that resonate with plant management and capital allocation processes.
Reactive vs. Proactive Maintenance: A KPI Performance Comparison
| Performance Metric | Reactive Maintenance Approach | Predictive Analytics Approach | Operational Impact |
|---|---|---|---|
| MTBF Trend | Flat or declining over 12 months | Consistent upward trend as failure precursors are addressed | Longer production campaigns between unplanned stops |
| MTTR Average | 4–8 hours due to undiagnosed root cause and parts scramble | Under 2 hours with pre-staged parts and documented repair procedures | Faster production restart reduces perishable product loss |
| OEE Score | Below 65% with high availability loss component | Above 80% with availability losses systematically reduced | Increased throughput without capital investment in new assets |
| Planned Maintenance Compliance | Below 70% as reactive work displaces scheduled tasks | Above 90% with automated scheduling and mobile work order delivery | Eliminates deferred maintenance as a reliability risk factor |
| Reactive Work Order Ratio | 50–70% of total maintenance activity is emergency repair | Below 20% with condition-based intervention replacing emergency response | Maintenance labor allocated to planned, efficient work |
| Maintenance Cost vs. RAV | 6–10% annually from premium parts, overtime, and production losses | 2–4% annually through planned interventions and extended asset life | Measurable maintenance budget reduction with documented ROI |
| Downtime Cost Visibility | Estimated manually from shift logs with significant data gaps | Calculated automatically per incident from production and labor systems | Accurate financial data supports capital investment decisions |
Asset Performance Management in Food Manufacturing: Beyond Basic KPI Tracking
Asset performance management (APM) in food manufacturing extends KPI tracking beyond simple availability and maintenance cost metrics into a comprehensive analytical framework that encompasses full asset lifecycle management, risk-based maintenance prioritization, and capital replacement planning. An effective APM strategy uses operational analytics software to calculate each asset's criticality index — weighing production impact, failure frequency, maintenance cost history, and remaining useful life — and allocates maintenance investment proportionally to criticality rather than treating all assets with equivalent maintenance intensity. Food manufacturers who deploy asset performance management platforms integrated with their maintenance management software report that criticality-based maintenance prioritization reduces overall maintenance spend while simultaneously improving reliability on the highest-impact production assets. Operational teams looking to build an APM framework around live sensor data and historical failure analytics can Book a Demo to explore iFactory's asset criticality scoring and lifecycle management capabilities.
Establish Baseline KPI Values Across All Critical Assets
Operational analytics software automatically calculates MTBF, MTTR, OEE, and compliance baselines from historical CMMS, historian, and sensor data — eliminating months of manual data collection before improvement programs can begin.
Deploy Live KPI Monitoring with Automated Alert Workflows
Purpose-built smart factory analytics platforms integrate with existing PLCs, SCADA historians, CMMS, and IoT networks — delivering a live KPI dashboard in days, not months, with no proprietary hardware required.
Use KPI Trend Data to Drive Continuous Reliability Improvement
Monthly KPI trend reviews drive maintenance procedure updates and spare parts strategy adjustments — systematically raising MTBF, reducing MTTR, and improving OEE over successive production periods.
Frequently Asked Questions: Analytics Management KPIs in Food Manufacturing
What is the difference between MTBF and MTTR in food manufacturing maintenance?
MTBF measures how long an asset runs before failing — higher is better, indicating strong reliability. MTTR measures how fast your team restores it after a failure — lower is better, reducing production loss. Together they define both failure prevention and recovery speed.
How does OEE calculation differ from simple equipment uptime tracking?
Uptime only tracks whether a machine is running — OEE also measures how fast it runs and how much good product it produces. An asset can show 95% uptime yet score far lower on OEE due to speed losses or quality rejects.
What data sources does predictive maintenance software use in food plants?
It draws from IoT vibration and temperature sensors, motor current transducers, SCADA historians, and CMMS work order records. Machine learning models trained on this combined data identify failure patterns before breakdowns occur.
How quickly can a food plant expect to see improvement in MTBF after deploying analytics?
Most plants see measurable MTBF gains within 60–90 days as live visibility exposes hidden compliance gaps and frequent failure patterns. Statistically significant improvement from predictive models typically appears within 6–9 months.
Which food manufacturing assets benefit most from continuous KPI monitoring?
High-criticality assets gain the most value — fillers, pasteurizers, homogenizers, refrigeration compressors, and CIP pumps. These are the assets where a single failure carries the highest production and food safety cost.
Start Tracking the KPIs That Drive Real Food Manufacturing Results
iFactory's operational analytics software delivers live MTBF, MTTR, OEE, and asset performance management dashboards purpose-built for food and beverage manufacturers — connecting sensor data, CMMS history, and production records into the manufacturing KPIs dashboard your maintenance and operations teams need to drive continuous reliability improvement.