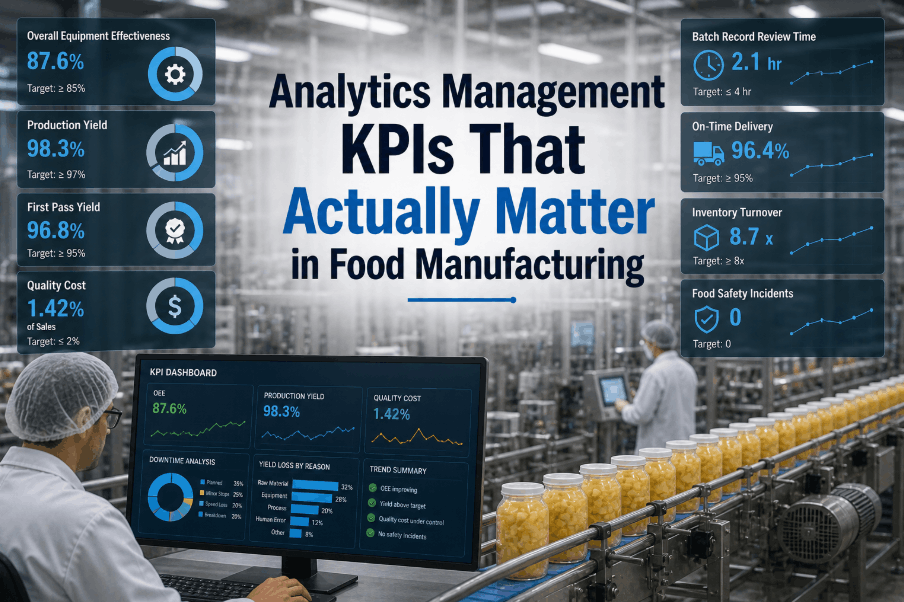
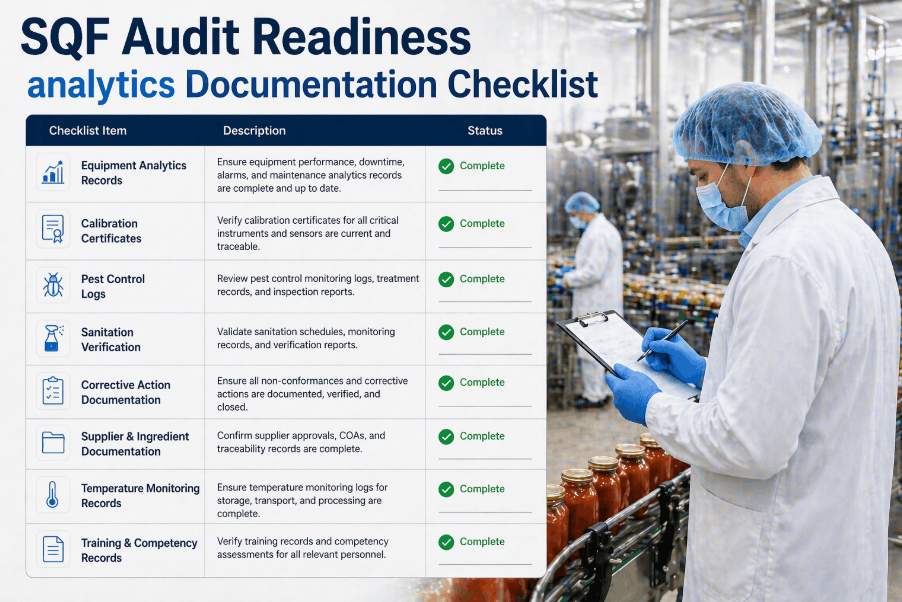
In modern food manufacturing,analytics teams are only as effective as the KPIs they track. As plants scale production volumes, manage tighter compliance windows, and adopt AI-driven maintenance strategies, relying on lagging indicators or disconnected spreadsheets is no longer viable. The most competitive food plants in 2025 are those that have defined a core set of food plant analytics KPIs—spanning equipment performance, sanitation, calibration, and audit readiness—and are monitoring them in real time. This guide covers the essential metrics every F&B analytics team must track, and how AI-driven dashboards are transforming how these numbers translate into operational action. Book a Demo to see how iFactory's Analytics & Reporting module surfaces these KPIs live, by line, by shift, and by asset.
Real-Time Analytics KPIs for Food & Beverage Manufacturing
iFactory gives F&B analytics teams a unified AI-powered platform to track PM compliance, OEE, MTTR, sanitation completion, calibration currency, and audit readiness—automatically, at plant scale.
Why Food Plant Analytics KPIs Are the Foundation of Operational Excellence
Food plant analytics is not simply about collecting data—it is about defining the right performance metrics for food manufacturing that connect asset behavior, workforce execution, and regulatory compliance into a single operational picture. Plants that track the wrong KPIs, or track the right ones on monthly cycles, consistently underperform on both output efficiency and audit outcomes.
A well-structured KPI framework for an F&B analytics team typically covers five domains: equipment reliability, maintenance execution, sanitation and hygiene compliance, instrument calibration currency, and audit readiness. Each domain has leading indicators—metrics that predict future outcomes—and lagging indicators that confirm whether past operations met targets. The most effective food manufacturing dashboards display both in real time, enabling analytics teams to intervene before a KPI deteriorates into a compliance event or a line stoppage.
The Six Core KPIs Every F&B Analytics Team Must Track
These six food plant performance metrics represent the highest-impact measurement areas across equipment, maintenance, hygiene, and compliance domains. Analytics teams that establish baselines and trend these weekly—not monthly—gain a measurable advantage in both operational efficiency and regulatory readiness. You can explore how each of these is tracked live by booking a demo with iFactory.
Overall Equipment Effectiveness (OEE)
OEE remains the gold-standard food plant OEE tracking metric, combining availability, performance rate, and quality rate into a single score. World-class food manufacturing operations target OEE above 85%. iFactory's OEE module disaggregates losses by shift, line, and failure mode—so analytics teams can direct improvement resources precisely rather than averaging across facilities.
PM Compliance Rate
Food plant PM compliance measures the percentage of scheduled preventive maintenance tasks completed on time versus total tasks due in a period. A PM compliance rate below 90% is a leading indicator of increased unplanned downtime and equipment degradation. AI-driven scheduling tools close the gap between what is planned and what is actually executed by technicians on the floor.
Mean Time to Repair (MTTR)
Food plant MTTR quantifies how quickly maintenance teams restore failed equipment to operational status. In high-throughput food lines, every additional minute of MTTR translates directly into lost production yield. Benchmarking MTTR by asset class and failure category enables analytics teams to prioritize spares inventory, technician training, and maintenance procedure redesign where they matter most.
Sanitation Completion Rate (SCR)
The sanitation completion rate tracks the percentage of sanitation tasks—by zone, line, or CIP circuit—completed within their scheduled windows and verified by digital sign-off. In food plants subject to FSMA, HACCP, and retailer audits, an SCR below 95% creates direct food safety exposure. Real-time SCR tracking closes the verification gap that paper-based sanitation logs create.
Calibration Currency
Calibration currency KPI measures the percentage of instrumentation—temperature sensors, pressure gauges, flow meters, pH probes—currently within their valid calibration window. Out-of-calibration instruments are an automatic major finding in FDA, BRC, and SQF audits. Analytics teams that track calibration currency in real time eliminate the scramble that occurs in the 30 days before an unannounced audit.
Audit Readiness Score
The food plant audit readiness score is a composite index that aggregates PM compliance, calibration currency, sanitation completion, and documentation completeness into a single percentage. Tracking this score continuously—rather than only preparing for known audit dates—represents the shift from reactive compliance to embedded quality culture. iFactory's audit readiness dashboard updates this score in real time as work orders are closed and records are digitally validated.
AI-Driven KPI Dashboards: From Reactive Reporting to Predictive Analytics
Traditional food manufacturing KPI tracking follows a cycle of monthly reports, end-of-shift summaries, and manually compiled compliance binders. By the time a KPI deteriorates to a critical threshold, the operational window to intervene has already closed.AI-driven KPI food manufacturing platforms fundamentally change this cycle by delivering continuous metric updates, predictive alerts, and root-cause correlation at a speed that reactive dashboards cannot match.
How iFactory Surfaces Analytics KPIs in Real Time
Unified Data Ingestion Across All Plant Systems
iFactory connects to CMMS, ERP, SCADA, and IoT sensor networks via open APIs and standard industrial protocols. Every maintenance work order closure, sensor reading, and sanitation record flows into a single analytics layer—eliminating the fragmentation that undermines KPI accuracy in multi-system environments.
Automated KPI Calculation and Baselining
The platform calculates OEE, MTTR, PM compliance, SCR, calibration currency, and audit readiness scores automatically against configurable targets and rolling baselines. Benchmarking is asset-specific—so a packaging line's OEE target is not diluted by averaging with a mixing operation running a fundamentally different production model.
Predictive Alerts Before KPIs Breach Thresholds
AI models trained on each asset's historical behavior detect degradation patterns before they produce a KPI breach. When a compressor's vibration signature trends toward a failure mode, or a line's PM backlog reaches a level that statistically precedes an OEE dip, iFactory alerts the analytics team proactively—not reactively. To see this alerting logic in action, book a demo with our platform team.
One-Click Audit-Ready KPI Reports
Analytics teams export structured KPI reports—PM compliance trends, MTTR histograms, calibration status exports, and sanitation completion logs—in formats directly compatible with BRC, SQF, FDA, and internal audit requirements. What previously required days of manual compilation is delivered in under 20 seconds.
KPI Benchmarking: Where Does Your Food Plant Stand?
Understanding your current food plant benchmarking position across each KPI is the prerequisite for setting meaningful improvement targets. The table below provides industry benchmark ranges based on plant maturity and operational complexity—giving analytics teams a calibrated baseline to measure gap and prioritize investment.
| KPI | Below Industry Average | Industry Average | World-Class Target | Impact if Untracked |
|---|---|---|---|---|
| OEE | <55% | 60–72% | ≥85% | 15–30% hidden capacity loss |
| PM Compliance Rate | <75% | 78–88% | ≥92% | 3× higher unplanned downtime |
| MTTR (Hours) | >6 hrs | 3–5 hrs | <2 hrs | Extended production stoppages |
| Sanitation Completion Rate | <88% | 90–95% | ≥97% | Critical audit findings, recall risk |
| Calibration Currency | <90% | 93–97% | 100% | Automatic major audit non-conformance |
| Audit Readiness Score | <78% | 82–90% | ≥94% | Reactive compliance firefighting |
Building a Food Plant Analytics Maturity Roadmap
Improving analytics performance food manufacturing teams deliver is not a single project—it is a progression through measurable maturity levels. Analytics leaders who have mapped this journey consistently report that the transition from Level 2 to Level 3 delivers the highest per-investment return, because it is where manual data gaps are eliminated and real-time visibility begins generating daily operational decisions. Book a demo to benchmark your plant's current analytics maturity against peer operations.
The Role of AI in Food Plant KPI Optimization
The most significant shift in F&B analytics metrics practice over the last three years has been the application of machine learning to KPI anomaly detection. Rather than alerting only when a metric breaches a static threshold, AI-driven platforms build dynamic behavioral models for each asset and each production pattern—alerting analytics teams when a trend line is heading toward a threshold breach, not after it has already occurred.
For food plants managing dozens of production lines, hundreds of instrumentation assets, and thousands of monthly PM tasks, this predictive layer eliminates the signal-to-noise problem that plagues manual KPI tracking. Analytics teams spend less time reviewing dashboards for problems and more time acting on pre-validated, prioritized recommendations surfaced by the AI layer.
Frequently Asked Questions: Analytics KPIs in Food Manufacturing
What is the most important KPI for food plant analytics teams?
OEE is typically the primary performance indicator because it integrates availability, performance, and quality into a single score. However, audit readiness score and sanitation completion rate carry equal strategic weight for plants operating under FSMA, BRC, or retailer audit frameworks, where compliance performance directly influences customer relationships.
How is PM compliance rate calculated in food plants?
PM compliance rate is calculated as the number of preventive maintenance tasks completed on schedule divided by the total number of tasks due in a measurement period, expressed as a percentage. iFactory calculates this automatically from work order data, disaggregated by asset class, line, and technician—without manual CMMS report exports.
What is calibration currency and why does it matter for audits?
Calibration currency is the percentage of critical instrumentation assets currently within their valid calibration window. Out-of-calibration instruments—whether temperature sensors, pressure gauges, or analytical probes—are automatic major non-conformances in FDA, BRC Global Standard, and SQF audits. Plants tracking calibration currency continuously eliminate the last-minute audit preparation burden.
How does MTTR differ from MTBF in food manufacturing analytics?
MTTR measures how quickly maintenance teams restore failed equipment—a measure of response efficiency. MTBF (Mean Time Between Failures) measures how long equipment operates reliably between breakdowns—a measure of inherent reliability. Analytics teams should track both: MTBF guides predictive maintenance scheduling, while MTTR guides technician workflow, spares availability, and escalation processes.
Can iFactory integrate with existing CMMS and ERP systems?
Yes. iFactory integrates with leading CMMS platforms (SAP PM, IBM Maximo, Infor EAM) and ERP systems via REST APIs and standard connectors. All KPI calculations use data from the connected systems in real time, with no manual data re-entry or shadow spreadsheets required.
How long does it take to establish reliable KPI baselines?
Most food plants establish statistically reliable KPI baselines within 3–4 weeks of iFactory deployment. AI anomaly detection models are active within the first full production cycle. Historical data migration from existing CMMS systems can accelerate baseline establishment to under 7 days in data-rich environments.
Stop Managing Food Plant Performance in the Dark
iFactory's Analytics & Reporting module gives your team live OEE, MTTR, PM compliance, sanitation completion, calibration currency, and audit readiness scores—all in one AI-driven platform built for food manufacturing scale.