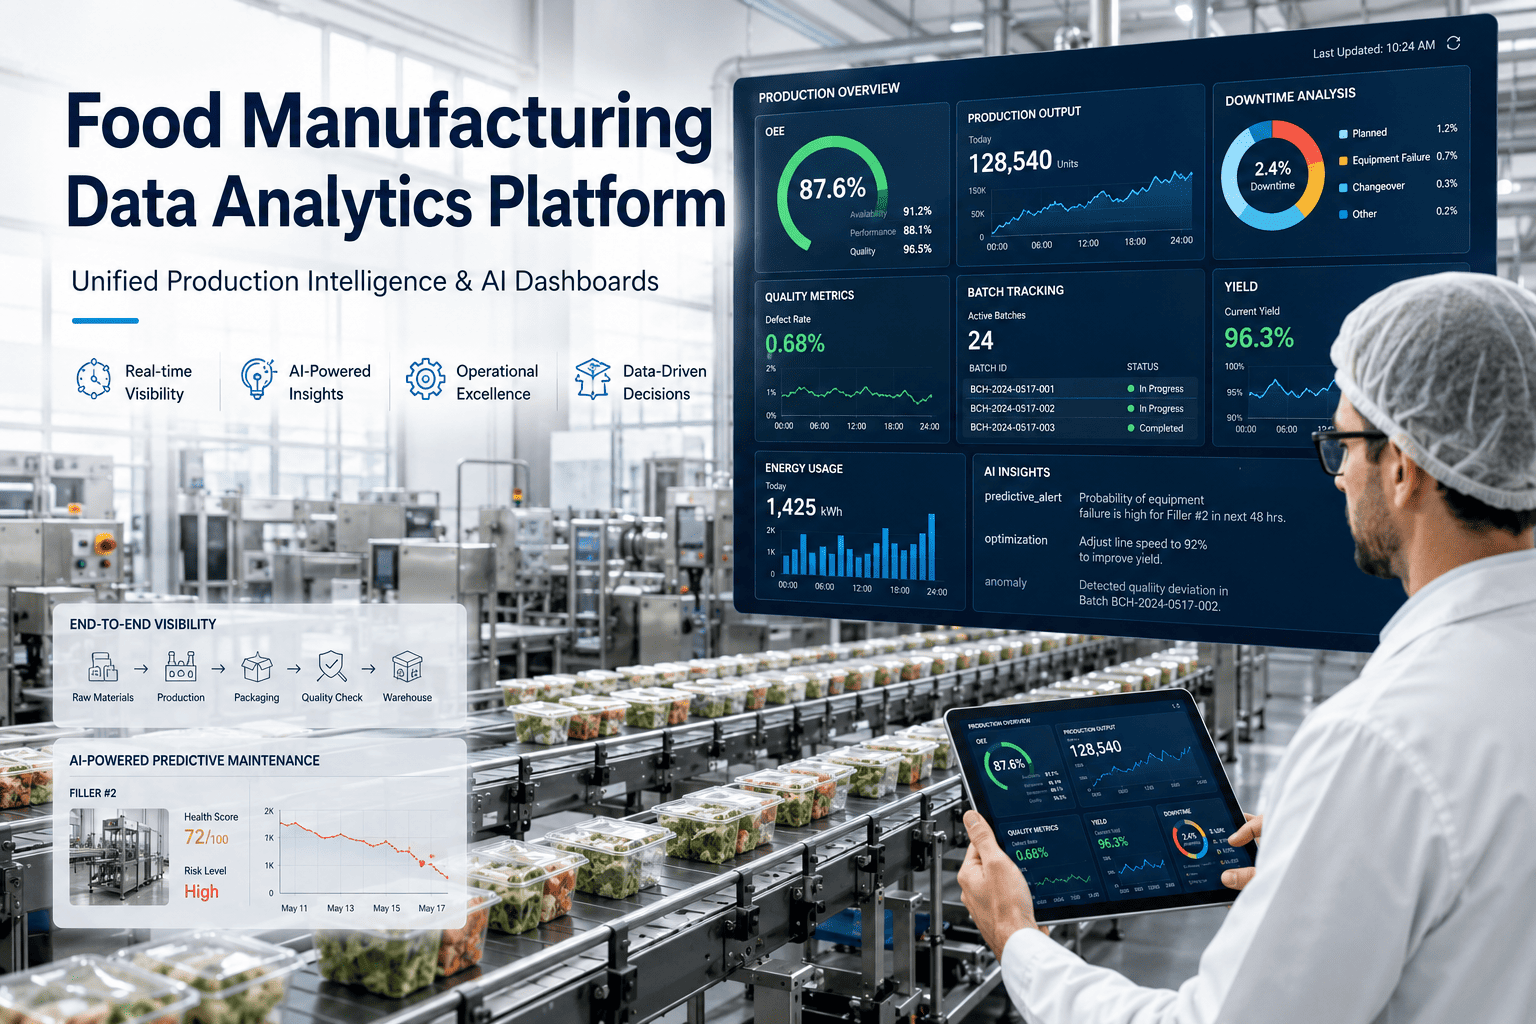
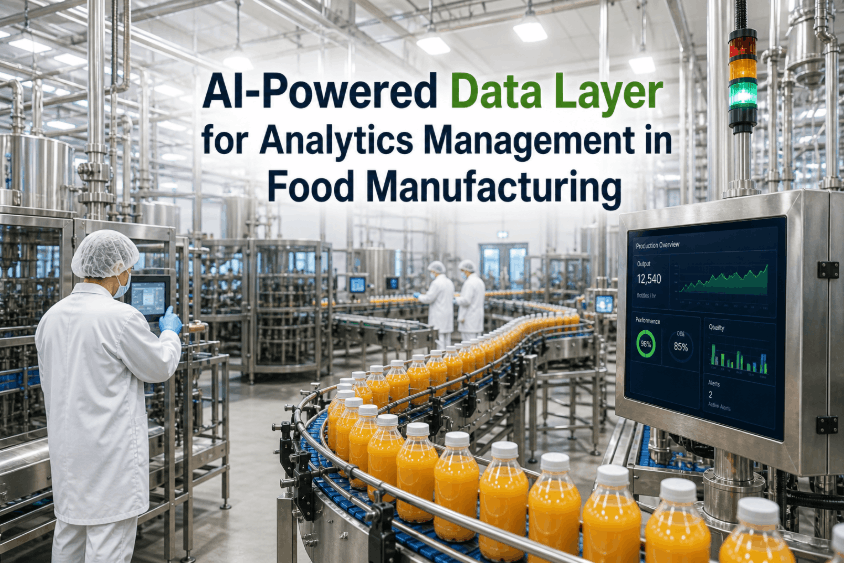
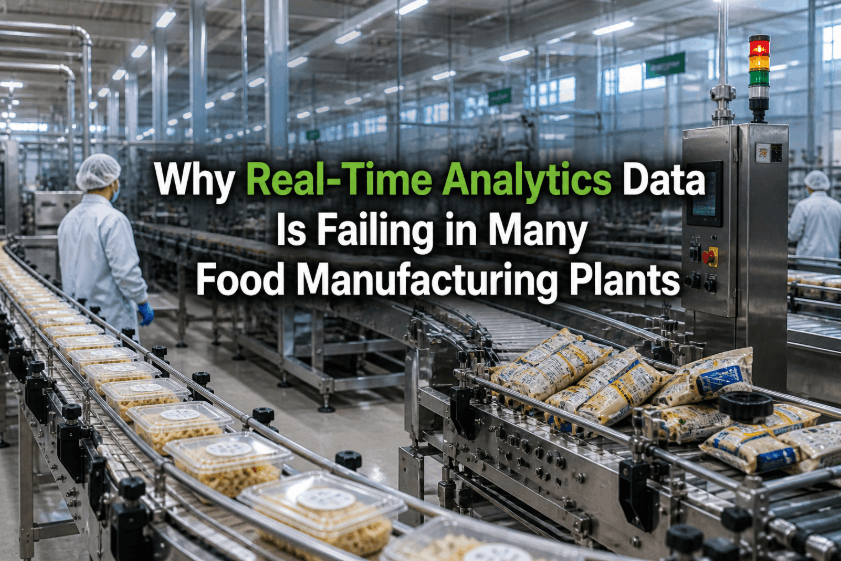
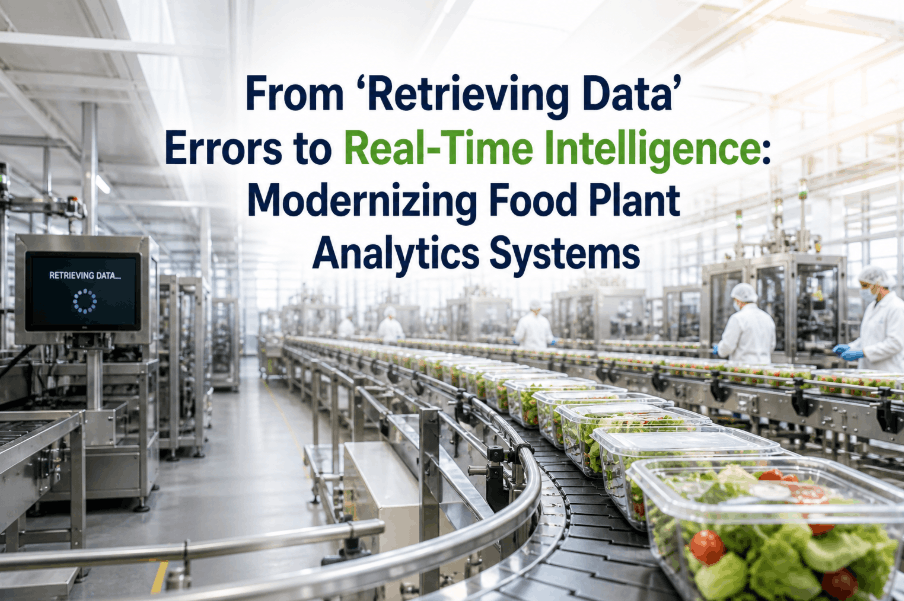
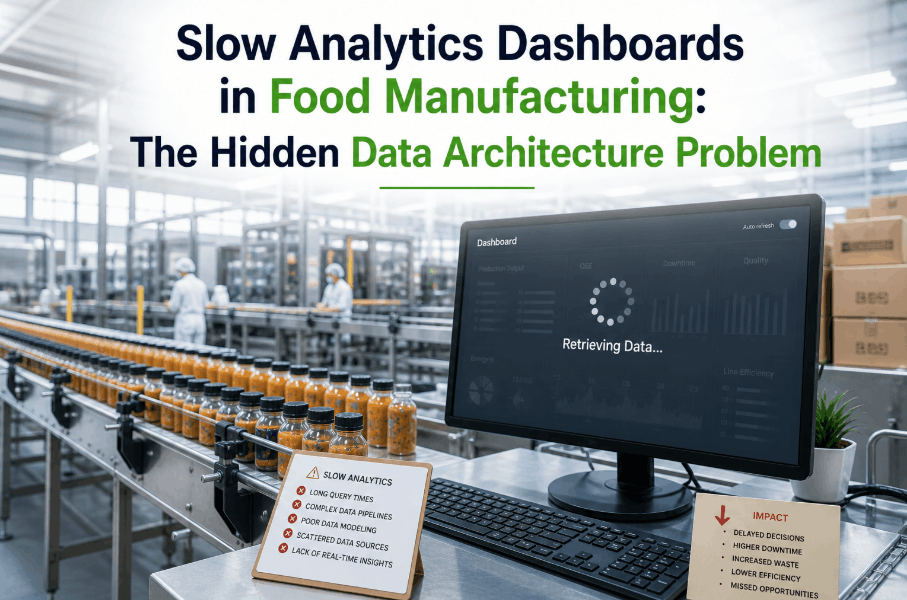
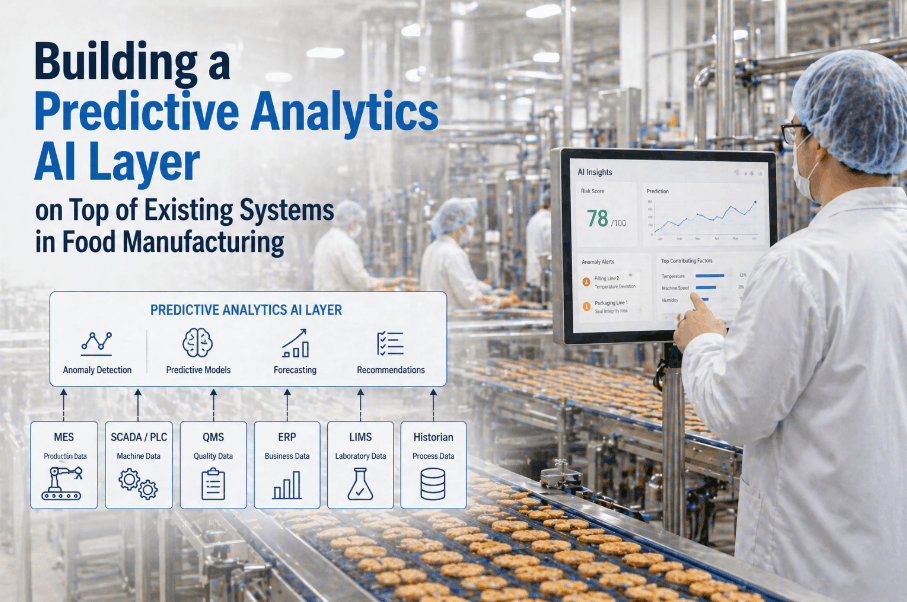
If your analytics dashboard is stuck on "Retrieving Data" every time your team needs actionable insights, you are not facing a minor inconvenience — you are facing a systemic performance failure that directly impacts operational decisions in your food manufacturing plant. Slow analytics dashboards, frozen data panels, and perpetual loading states are among the most disruptive productivity killers in modern manufacturing environments. The root cause is rarely a single broken component. It is a structural mismatch between legacy data pipelines and the real-time demands of AI-driven analytics platforms. Understanding why this happens — and how AI-optimized data architecture eliminates it permanently — is the first step toward reclaiming the operational visibility your facility depends on. Book a Demo to see how AI-driven analytics handles high-volume plant data without lag.
What Does "Retrieving Data" Actually Mean in Your Analytics System?
When your analytics software displays "Retrieving Data" indefinitely, it signals that the query layer has sent a data request but the response has not returned within an expected threshold. In food manufacturing plants running multi-line operations, this typically occurs because the data retrieval pipeline is simultaneously processing sensor telemetry, batch production records, quality control entries, and ERP transactions — all through a single, unoptimized query engine. The system is not broken. It is overwhelmed.
The "Retrieving Data" state becomes a recurring problem when your analytics architecture was designed for data volumes significantly smaller than your current operational footprint. As plants scale — adding SKUs, production shifts, sensor endpoints, and compliance recordkeeping — legacy query models buckle under the concurrency load. Every additional dashboard widget requesting a live data pull compounds the latency, and your team spends more time watching loading indicators than making data-driven decisions.
The 5 Root Causes Behind Analytics Dashboard Lag in Food Plants
Diagnosing a slow analytics system requires looking beyond surface symptoms. The "Retrieving Data" error is a final output — the visible result of several compounding architectural failures that accumulate over months of plant growth. Here are the five most common root causes identified in food manufacturing analytics environments.
Non-Indexed Database Queries Running at Scale
When production databases grow beyond a few million rows, non-indexed table scans become exponentially slower. Most legacy analytics setups were not designed with index optimization in mind — resulting in full-table reads every time a dashboard widget refreshes. At high query concurrency across a shift operations team, this single issue accounts for the majority of "Retrieving Data" states in food plant analytics platforms.
Synchronous Data Pipeline Architecture
Synchronous pipelines process data requests sequentially — one at a time, in order. In a food manufacturing plant generating thousands of data points per minute from PLCs, sensors, and quality checkpoints, synchronous data flows create severe bottlenecks. A single slow upstream data source (a lagging ERP sync, for example) blocks every dashboard that depends on it, producing plant-wide analytics freezing during peak production periods.
Absence of Data Caching and Pre-Aggregation
Analytics dashboards that recalculate every metric from raw data on every page load are inherently inefficient. Without intelligent caching layers and pre-aggregated data models, your system repeats expensive calculations continuously. This is especially damaging for KPI dashboards displaying running totals, yield percentages, and OEE metrics that update in near-real-time — each refresh triggers a full recalculation cycle instead of serving a pre-built result. If your team has ever noticed that book a demo helps show how cached data models can cut load times by over 80%.
Oversized Data Payloads Sent to the Frontend
Many analytics platforms retrieve entire datasets and filter them client-side — meaning your browser or tablet receives tens of thousands of rows before rendering a single chart. In food plant environments where operators are using ruggedized tablets or lower-bandwidth factory floor networks, this payload problem manifests as frozen dashboards and "Retrieving Data" states that persist for 30 seconds or longer. Proper server-side filtering and pagination eliminate this pattern entirely.
Unmanaged Concurrent User Load
When multiple shift supervisors, quality managers, and line operators open their dashboards simultaneously at shift change, concurrent query load spikes dramatically. Systems without connection pooling, request queuing, or load balancing collapse under this demand — producing the exact "Retrieving Data" freeze your team experiences every day at 6 AM, 2 PM, and 10 PM. AI-driven query management eliminates this concurrency failure by intelligently prioritizing and batching dashboard requests based on user role and operational urgency.
How AI-Driven Data Architecture Eliminates Analytics System Lag
AI-optimized analytics platforms approach data retrieval fundamentally differently from legacy systems. Rather than treating every dashboard request as an isolated, synchronous query, AI-driven architectures apply predictive prefetching, intelligent caching, and adaptive query routing to deliver sub-second dashboard performance — even across complex, high-volume food manufacturing data environments. The result is an analytics system that never shows "Retrieving Data" because it anticipates what data users need before they ask for it.
The performance gains are not incremental. Facilities that migrate from legacy analytics platforms to AI-optimized data architectures consistently report dashboard load time reductions of 85–95%, elimination of data lag during peak concurrent usage, and a measurable increase in the number of data-driven decisions made per shift. This is not a configuration fix — it is a structural upgrade to how your plant's operational intelligence works. You can book a demo to see a live side-by-side comparison of legacy vs. AI-optimized dashboard performance.
Predictive Data Prefetching
AI models analyze user behavior patterns — which dashboards each role opens, at what times, in what sequence — and prefetch the required data before users navigate to those views. By the time a shift supervisor opens their OEE dashboard, the data is already loaded and rendered. Zero "Retrieving Data" states. Zero waiting.
Intelligent Query Caching Layers
AI-driven caching systems determine which metrics are safe to serve from cache and which require a live database pull — based on data freshness requirements and the user's operational context. Static compliance reports are served instantly from cache. Live production line KPIs are streamed in real time. No unnecessary recalculations. No redundant queries.
Asynchronous Parallel Data Pipelines
AI-optimized platforms replace synchronous data flows with asynchronous, parallel processing pipelines — so a slow ERP sync never blocks real-time sensor data, and a heavy compliance report query never degrades live dashboard performance. Each data stream operates independently, with AI orchestration ensuring consistent delivery across all dashboard consumers.
Adaptive Query Routing and Load Balancing
During peak concurrency periods — shift changes, audit preparation, end-of-day reporting — AI-driven query routing automatically balances load across available compute resources, prioritizes critical operational queries, and defers non-urgent background jobs. The system maintains consistent performance regardless of how many users are active simultaneously.
Analytics Dashboard Performance: Legacy vs. AI-Optimized Architecture
The performance gap between legacy analytics systems and AI-driven platforms is measurable across every key operational metric. The table below compares typical performance benchmarks for food manufacturing analytics environments before and after AI-driven data architecture implementation.
| Performance Metric | Legacy Analytics System | AI-Optimized Platform | Improvement |
|---|---|---|---|
| Dashboard Load Time (avg) | 18–45 seconds | Under 2 seconds | ~90% faster |
| "Retrieving Data" Freeze Events/Day | 12–30 per shift | Near zero | Eliminated |
| Peak Concurrency Handling (users) | 3–5 simultaneous | 50+ simultaneous | 10x capacity |
| Query Execution (complex reports) | 60–180 seconds | 3–8 seconds | ~95% faster |
| Data Freshness (production KPIs) | 5–15 minute lag | Real-time / sub-30s | Real-time visibility |
| System Availability During Audits | Degraded performance | Full performance maintained | Zero degradation |
The Real Operational Cost of Slow Analytics in Food Manufacturing
Analytics dashboard lag is rarely treated as a critical operational problem until it is. The true cost of a system stuck on "Retrieving Data" is not measured in seconds of load time — it is measured in decisions that were delayed, quality deviations that were missed, and compliance records that were not produced on time. In food manufacturing environments operating under FSMA, GFSI, and customer audit requirements, the operational consequences of unreliable analytics access are substantial.
A shift supervisor waiting 45 seconds for an OEE dashboard to load loses approximately 18 minutes per shift to system lag. Across three shifts and 250 operating days, that is 225 hours of lost supervisory productivity per year — per user. For a team of 10 supervisors and managers, the annual productivity loss exceeds 2,200 hours. At the same time, delayed quality data visibility means corrective actions are initiated later in the production cycle, increasing the volume of product that must be held, reworked, or rejected. AI-driven analytics systems that eliminate dashboard lag effectively recover this hidden productivity cost and reduce quality deviation cycle times by enabling faster detection and response. Want to calculate your plant's specific lag cost? Book a demo for a customized operational cost assessment.
Most Common Analytics System Performance Gaps in Food Plants
Industry assessments of food manufacturing analytics deployments consistently identify the same performance failure patterns. These gaps compound over time — each one individually manageable, but collectively responsible for the chronic "Retrieving Data" experience your team has normalized.
How to Fix Your Analytics System: A Step-by-Step Optimization Roadmap
Resolving chronic analytics dashboard lag requires a structured approach that addresses each layer of the performance failure stack — from database indexing through frontend data delivery. The following five-phase roadmap is designed for Operations Technology and IT leads in food manufacturing facilities looking to eliminate "Retrieving Data" states permanently.
Performance Baseline Audit: Measure Before You Fix
Before making any architectural changes, establish a quantified performance baseline. Measure average dashboard load times by user role, identify which dashboards produce the most "Retrieving Data" events, log peak concurrency periods, and document the data sources driving the slowest query response times. This baseline becomes your benchmark for measuring improvement and prioritizing which fixes deliver the highest operational ROI.
Database Query Optimization and Index Implementation
Audit the top 20 slowest queries in your analytics database and implement targeted indexing strategies for the fields most commonly used in dashboard filters — timestamps, lot codes, line identifiers, product categories. This single intervention typically reduces query execution time by 60–75% on legacy databases without requiring infrastructure changes. Combine index optimization with query rewriting to eliminate redundant joins and subquery patterns that compound response times.
Introduce Pre-Aggregation and Intelligent Caching
Implement pre-aggregated data models for your most-accessed KPIs — OEE, yield rates, quality pass/fail counts, compliance status — and serve these from a caching layer rather than recalculating on demand. Define cache invalidation rules based on data update frequency: real-time sensor KPIs refresh on event; shift summary reports refresh hourly; compliance records refresh on write. This architecture reduces database load by 70–85% for typical food manufacturing dashboard environments.
Migrate to Asynchronous Pipeline Architecture
Redesign your data ingestion and delivery pipelines to operate asynchronously — decoupling slow upstream sources (ERP, MES) from real-time dashboard data streams. Use event-driven architecture patterns so that a delayed batch sync never propagates lag to live operational dashboards. Asynchronous pipelines also enable granular retry and fallback logic, eliminating the "Retrieving Data" freeze that occurs when a single upstream source fails or slows.
Deploy AI-Driven Query Management and Predictive Prefetching
The final layer of the optimization stack is AI-driven query orchestration — the capability that eliminates "Retrieving Data" states permanently rather than just reducing their frequency. AI models trained on user navigation patterns prefetch and cache dashboard data before it is requested. Adaptive load balancing routes concurrent queries intelligently during peak periods. Predictive anomaly detection flags upstream data source degradation before it impacts dashboard availability. This is the architecture that makes food plant analytics truly real-time.
Frequently Asked Questions: Analytics System "Retrieving Data" Issues
Why does my analytics dashboard keep showing "Retrieving Data" for minutes at a time?
This typically occurs when unindexed database queries, synchronous pipeline bottlenecks, or concurrent user overload prevent the system from returning results within an acceptable threshold. In food manufacturing environments, rapid growth in production data volume without matching query optimization is the most frequent cause.
Can AI eliminate analytics dashboard lag without replacing our entire system?
In many cases, AI-driven caching and query routing layers can be added on top of existing infrastructure without a full platform replacement. However, facilities with deeply synchronous pipelines or severely unoptimized databases typically see stronger long-term results by migrating to a purpose-built AI-driven analytics platform.
How long does it take to fix a slow analytics system in a food plant?
Database indexing and query optimization can deliver measurable improvement within days. A full AI-driven architecture migration — covering async pipelines, caching, and prefetching — typically takes 6–12 weeks, with most facilities seeing 70–80% load time reduction within the first two weeks.
What is the fastest fix for analytics software freezing during shift changes?
Implementing connection pooling and request queuing at the database layer provides the fastest relief — it prevents concurrent query spikes from collapsing the system at shift change. For a permanent solution, AI-driven predictive prefetching pre-loads dashboards before peak concurrency occurs, eliminating the freeze entirely.
Does AI-driven analytics also speed up compliance record retrieval?
Yes. With intelligent caching and indexed lot-level traceability records, compliance data that previously took 20–40 minutes to compile becomes available in under 60 seconds — a critical advantage for facilities subject to FDA FSMA Section 204's 24-hour record production requirement.
Is the "Retrieving Data" problem specific to older analytics platforms, or can it affect modern systems too?
It affects both. Even modern analytics platforms experience retrieval lag when deployed in high-volume food manufacturing environments without proper query optimization, caching strategy, or asynchronous pipeline design. The issue is architectural, not generational — any system that outgrows its original data model will exhibit these symptoms.
How does AI-driven analytics handle real-time sensor data without causing dashboard overload?
AI-optimized platforms separate high-frequency sensor streams from historical query workloads using dedicated ingestion pipelines and tiered data models. Real-time KPIs are served from in-memory caches updated on event, while historical reports run against pre-aggregated datasets — keeping dashboards fast regardless of sensor data volume.