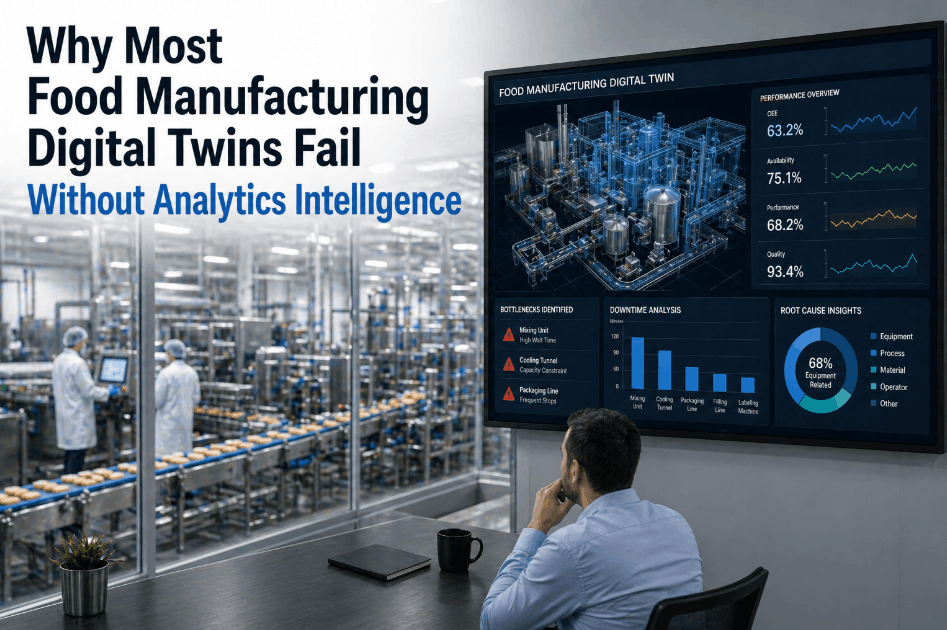
Digital twin technology for food manufacturing is fundamentally rewriting how plants model, monitor, and optimize production performance. By creating a live virtual replica of every machine, process, and material flow on your plant floor, a digital twin analytics platform allows operations teams to simulate changes, predict failures, and fine-tune throughput—without disrupting a single production run. For food and beverage manufacturers under pressure from volatile input costs, tightening regulatory mandates, and razor-thin margins, adopting AI-driven manufacturing optimization through digital twin technology is no longer a future investment. It is the operational foundation that separates high-performing plants from those permanently playing catch-up. This guide explores how digital twin simulation, predictive maintenance for food plants, and real-time operational analytics combine to deliver measurable intelligence across every layer of food manufacturing.
See Your Plant as a Live Digital Model
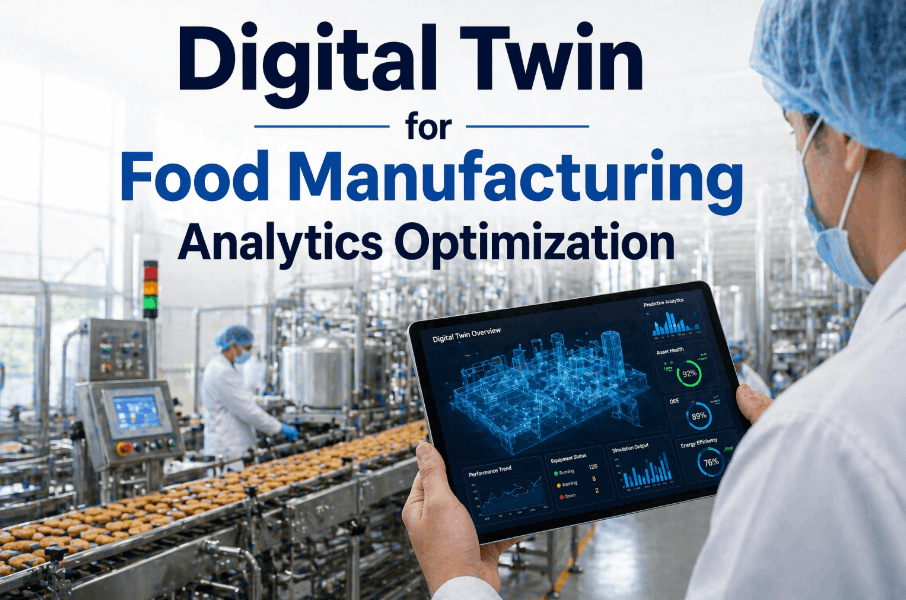
iFactory's digital twin platform delivers real-time simulation, predictive alerts, and AI-driven optimization built for F&B production environments.
What Is a Digital Twin in Food Manufacturing and Why Does It Matter?
At the core of digital twin technology is the convergence of industrial IoT data streams, physics-based process models, and machine learning inference engines. When a filling line's digital twin detects a 0.3°C temperature variance in a pasteurizer jacket, it doesn't simply log the reading—it simulates the downstream effect on viscosity, correlates the pattern against historical seal failure data, and issues a maintenance alert before any product is compromised. This is the difference between operational performance monitoring and genuine manufacturing intelligence software. Manufacturers who book a demo with iFactory consistently report that the first live demonstration of this causal simulation capability is the moment digital twin ROI becomes concrete and undeniable for their leadership teams.
Real-Time Asset Synchronization
Every physical asset—mixer, conveyor, CIP system, checkweigher—has a virtual counterpart updated continuously via IoT sensor feeds. State changes propagate to the model within milliseconds, enabling live operational visibility across all production zones.
Predictive Process Simulation
Physics-informed models simulate how current process conditions will evolve over the next 2–72 hours. Quality deviations, yield losses, and compliance breaches are surfaced before they materialize on the physical line.
Scenario Testing Without Risk
Production engineers can model recipe changes, line speed adjustments, or new equipment configurations entirely within the digital twin—validating outcomes before any physical change is executed, eliminating trial-and-error downtime.
Cross-Line Intelligence Fusion
Digital twins aggregate data across all production lines, enabling cross-line performance benchmarking, shared anomaly detection models, and enterprise-wide OEE visibility from a single operational intelligence layer.
Predictive Maintenance for Food Plants: How Digital Twins Eliminate Reactive Downtime
Digital twin platforms resolve this trade-off by monitoring equipment health at the component level. Vibration signatures from pump bearings, thermal gradients across motor windings, and torque profiles on mixing agitators are analyzed continuously against degradation curves derived from thousands of historical failure events. When a pattern matches a precursor signature—even one that would be imperceptible to scheduled inspection—the platform triggers a maintenance work order with enough lead time to plan the intervention during a scheduled changeover rather than a crisis shutdown. Plants that have deployed this approach with iFactory report that booking a demo was followed by a discovery that 38–55% of their historical unplanned downtime events had detectable precursor signatures in data they were already collecting but not analyzing.
Asset Performance Management Through Digital Twin Analytics: A Framework for F&B Plants
The financial impact compounds quickly. A filling line running at 87% of its theoretical throughput due to uncorrected micro-stoppages—events too brief to trigger a downtime log but frequent enough to aggregate into significant production loss—is invisible to traditional OEE reporting but immediately visible in its digital twin. The platform identifies the specific causal chain: product changeover friction, seal wear-induced hesitation, or upstream flow restriction. It quantifies the throughput gap in real units per hour and dollars per shift. This level of granularity is what finance teams need to approve capital reinvestment with confidence, and it is what makes platforms like iFactory compelling enough that operations directors routinely request a demo before completing their annual CapEx submission.
| APM Capability | Traditional Approach | Digital Twin Approach | Financial Impact |
|---|---|---|---|
| Throughput Monitoring | Shift-end production counts | Continuous per-cycle tracking vs. model | +6–11% recoverable output |
| Energy Performance | Monthly utility billing | Real-time kWh per unit produced | 12–18% energy cost reduction |
| Equipment Lifespan | OEM-specified replacement intervals | Condition-based remaining useful life | 22–34% CapEx deferral |
| Quality Contribution | End-of-line sampling | Per-asset quality causality scoring | Giveaway reduced by 15–22% |
| Compliance Readiness | Periodic audit documentation | Continuous digital compliance log | Audit prep time cut by 70% |
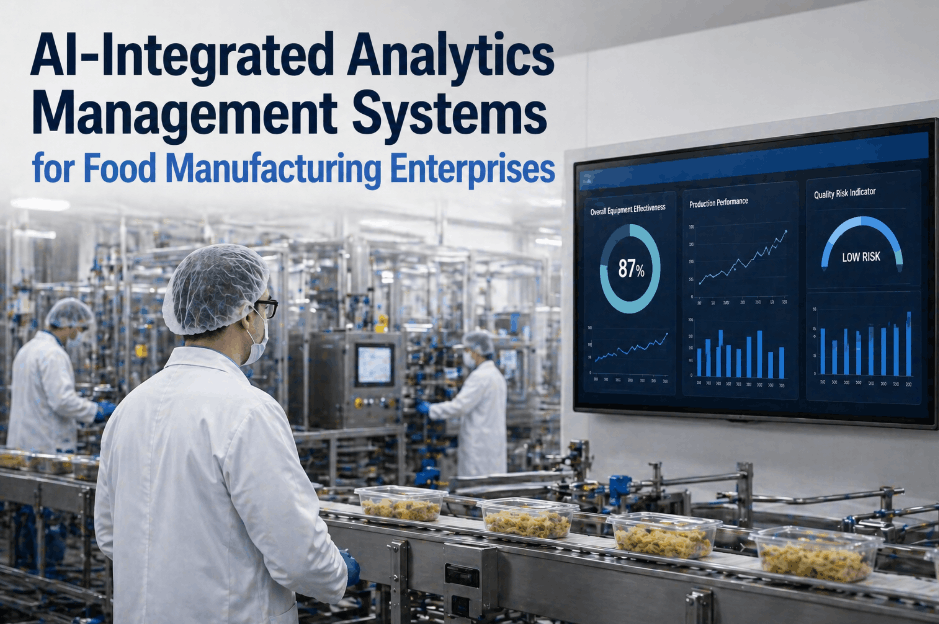
Real-Time Operational Analytics: Turning Digital Twin Data Into Production Intelligence
Real-time operational analytics powered by digital twin data transforms raw sensor streams into layered production intelligence that every stakeholder—from line operators to CFOs—can act on within their decision horizon. The architectural distinction between a digital twin analytics platform and a conventional SCADA or MES reporting module is the addition of causal inference: not just what happened, but why, and what will happen next if the current trajectory continues.
Process Optimization Analytics: Closing the Loop Between Data and Action
Process optimization analytics within a digital twin environment operate on a closed-loop principle. The platform detects a deviation, simulates its root cause, recommends a corrective parameter adjustment, and—on lines with closed-loop control integration—executes the adjustment autonomously within operator-defined safety boundaries. This autonomous correction capability is what moves smart factory simulation from a visualization tool into an active production management system. For food manufacturers managing 4–12 simultaneous SKUs across multiple lines, this real-time process intelligence layer effectively multiplies the decision-making capacity of every quality and operations engineer on shift.
Digital Transformation in the Food Industry: The Data Infrastructure Imperative
Sustained digital transformation in the food industry requires more than deploying sensors and dashboards. It demands a data infrastructure capable of contextualizing operational signals against production models, regulatory requirements, and financial targets simultaneously. Digital twin platforms provide this context by maintaining a persistent operational history—a searchable, auditable record of every process state, quality measurement, and equipment behavior that enables root-cause investigation in minutes rather than days. When regulatory inspectors arrive or recall risk is elevated, this capability is not a competitive advantage. It is a compliance necessity. Food manufacturers who have integrated iFactory's digital twin platform report that this contextual audit trail reduces FDA inspection preparation time from 3–5 days to under 4 hours. For operations teams still managing this work manually, a demo conversation is typically the fastest path to quantifying how much that gap is currently costing them in staff hours and compliance risk exposure.
Digital Twin Implementation Roadmap for Food Manufacturing Plants
Deploying a digital twin analytics platform in a food manufacturing environment follows a structured three-phase architecture that balances the urgency of ROI capture with the operational stability requirements of regulated production. Rushing any phase undermines the data quality that the entire intelligence layer depends on.
Sensor Infrastructure & Data Historian Foundation
Deploy IoT edge devices, instrument critical control points, and establish a validated data historian. This phase defines the fidelity ceiling of everything built above it. Pre-deployment sensor audits—mapping measurement requirements to specific process risks—prevent costly remediation in later phases. Timeline: 8–14 weeks. CapEx: $60k–$180k depending on line count and existing instrumentation density.
Digital Twin Model Calibration & Intelligence Layer Deployment
Commission the digital twin models using historical process data, calibrate physics-based simulations against real production runs, and activate AI-driven anomaly detection and predictive maintenance modules. This phase is where the platform begins generating actionable insights and measurable ROI signals. Timeline: 6–10 weeks. Platform cost: $35k–$80k/year.
Closed-Loop Optimization & Autonomous Production Intelligence
Integrate digital twin outputs with MES, ERP, and process control systems to enable closed-loop parameter corrections, automated compliance reporting, and AI-driven production scheduling. This phase transforms the digital twin from a monitoring system into an active optimization engine. Timeline: Ongoing. Incremental OpEx: $18k–$45k/year.
Quantifying Digital Twin ROI: The Three Financial Dimensions Every F&B CFO Needs
Dimension 1 — Yield and Throughput Recovery
The most immediately quantifiable ROI dimension is yield recovery from micro-stoppage elimination, giveaway reduction, and rework avoidance. A beverage plant producing 15 million units annually with a 1.1% giveaway rate and 74% OEE has mathematically recoverable losses exceeding $400,000 per year at industry-average material costs. Digital twin-driven optimization routinely captures 60–80% of this recoverable value within the first operating year—delivering payback on platform investment in under 9 months for high-throughput lines. Food manufacturers exploring this calculation for their specific production parameters find that an iFactory demo session provides a live, plant-specific yield recovery model rather than generic industry benchmarks.
Dimension 2 — Compliance and Recall Risk Reduction
The second ROI dimension is probabilistic but actuarially defensible. Every food plant carries an annualized recall risk exposure calculable from its historical deviation frequency, product volume, and distribution footprint. A digital twin analytics platform that compresses deviation detection from hours to minutes does not eliminate this risk, but it measurably reduces the expected severity of any event—and that reduction has a quantifiable expected value that belongs in every CapEx proposal submitted to finance leadership. FDA compliance documentation generated automatically by the digital twin's continuous audit log also eliminates the $15k–$40k in annual labor currently consumed by manual compliance report preparation at most mid-size food plants.
Dimension 3 — Energy and Maintenance Cost Optimization
The third dimension—frequently underestimated in initial ROI models—is the compound saving from energy optimization and maintenance cost restructuring. Digital twin-driven energy analytics identify peak-demand reduction opportunities, equipment operating point inefficiencies, and CIP cycle over-runs that collectively represent 12–18% of avoidable utility spend in the average food plant. When combined with the CapEx deferral value of condition-based asset management—extending equipment service life 22–34% beyond OEM calendar schedules—this dimension alone frequently justifies the platform investment independently of any yield or compliance benefit.
Digital Twin Impact Across Key Food Manufacturing KPIs
The performance gains from deploying a digital twin analytics platform span every operational dimension — from OEE and giveaway reduction to energy efficiency and compliance readiness. The chart below benchmarks the average improvement food plants achieve across critical KPIs within 12 months of full digital twin deployment, based on iFactory customer data across beverage, dairy, protein, and packaged goods production environments.
Digital Twin Food Manufacturing Analytics — Frequently Asked Questions
How does a digital twin differ from a standard SCADA or MES system in food manufacturing?
SCADA and MES systems record and display operational data. A digital twin adds a continuously updated simulation model that correlates live sensor data with physics-based process models and historical failure patterns—enabling predictive forecasting and causal root-cause analysis rather than retrospective event logging. The distinction is the difference between observing a process and understanding it.
What data sources feed a digital twin in a food manufacturing plant?
Digital twins ingest IoT sensor streams (temperature, pressure, flow, vibration, weight), PLC and SCADA signals, MES batch records, ERP material transactions, and quality inspection data. The more data sources integrated, the higher the simulation fidelity and the more accurate the predictive models. Most deployments achieve meaningful intelligence with 60–80% of available data sources connected at launch.
How long does it take to deploy a digital twin analytics platform in a food plant?
Full deployment—from sensor infrastructure commissioning through AI model calibration and dashboard activation—typically requires 14–24 weeks for a mid-size plant with 2–4 production lines. Plants with existing IoT infrastructure and historian systems can achieve initial insights within 6–8 weeks. iFactory's pre-deployment sensor audit process significantly reduces integration risk and accelerates time-to-value.
Can a digital twin platform integrate with existing ERP and MES systems?
Yes. Modern digital twin platforms provide bidirectional API connectors for SAP, Oracle, Microsoft Dynamics, and most major MES vendors. This integration enables analytics insights to feed directly into production scheduling, procurement forecasting, and quality management workflows—amplifying the value of existing enterprise systems rather than replacing them.
What is the typical ROI payback period for digital twin investment in food manufacturing?
Most food plants achieve full payback within 8–18 months, depending on baseline OEE, giveaway rate, and maintenance cost structure. High-throughput lines with historically loose process controls and reactive maintenance practices frequently achieve payback in under 6 months. Lines with existing instrumentation and historian infrastructure see the shortest deployment timelines and fastest payback periods.
How does digital twin technology support FDA and GFSI compliance in food plants?
Digital twin platforms generate a continuous, auditable record of all process conditions, equipment states, quality measurements, and corrective actions. This persistent digital compliance log eliminates manual documentation workflows, reduces audit preparation time by 60–70%, and provides inspectors with verified, time-stamped evidence of process control at every production stage—significantly reducing regulatory exposure during FDA inspections and GFSI recertification cycles.
Deploy a Digital Twin That Actually Optimizes Your Food Plant
iFactory's digital twin analytics platform delivers real-time asset intelligence, closed-loop process optimization, and AI-driven predictive maintenance — purpose-built for food and beverage manufacturing.