A visually clean surface and a genuinely sanitized surface are not the same thing, and the gap between them is exactly what ATP bioluminescence testing was built to close. A stainless steel table can look spotless under plant lighting while still carrying organic residue — food particles, biofilm, microbial byproducts — invisible to the eye but chemically detectable in seconds. ATP testing gives sanitation teams a rapid, quantitative readout of that residue, converting "does this look clean" into a specific relative light unit number that can be measured against a pass/fail threshold and tracked over time. Getting real value from an ATP program means understanding not just how to run the swab, but how to interpret the number it produces, set thresholds that actually mean something for your specific surfaces, and use trend data to catch sanitation program drift before it becomes a food safety issue.
How ATP Bioluminescence Testing Actually Works
ATP, or adenosine triphosphate, is the energy molecule present in all living cells — bacterial, fungal, plant, and animal. Its presence on a food-contact surface indicates organic residue that survived cleaning, whether that residue is actual microbial contamination or simply food soil that sanitation missed. ATP testing works by using a luciferase enzyme reaction that produces light proportional to the amount of ATP present, measured by a handheld luminometer and reported as relative light units, commonly abbreviated RLU.
What makes this test genuinely valuable for daily sanitation verification is speed. A microbial swab sent to a lab for culture-based testing typically takes 24 to 72 hours to produce a result, which means by the time a contamination problem is confirmed, the affected equipment may have already run several more production cycles. ATP testing delivers a result in roughly 10 to 15 seconds, allowing a sanitation supervisor to verify a surface immediately after cleaning and, if it fails, re-clean and re-test before production even begins — a speed advantage that fundamentally changes what's operationally possible for pre-operational sanitation verification.
The test doesn't directly count bacteria — it's a proxy measurement for organic residue broadly, which is precisely why it's valuable as a rapid verification tool rather than a replacement for microbial testing. A high RLU reading doesn't necessarily mean a specific pathogen is present, but it reliably indicates that a surface wasn't adequately cleaned, which is itself the condition that allows pathogens to survive and grow between production runs.
Pass/Fail RLU Thresholds — Why One Number Doesn't Fit Every Surface
A common mistake in ATP program design is applying a single pass/fail threshold uniformly across every surface in the facility. Different surface types, materials, and food contact risk levels warrant different thresholds, since the acceptable residue level on a high-risk, direct-product-contact surface should be considerably stricter than a lower-risk environmental surface. A single uniform threshold across a facility either sets the bar too low for the highest-risk surfaces, creating false confidence exactly where it matters most, or sets the bar so strict for lower-risk environmental surfaces that sanitation crews spend disproportionate time re-cleaning areas that pose minimal actual food safety risk. Book a demo to see how threshold configuration applies to your specific surface zones.
| Surface Category | Example Locations | Typical Pass Threshold (RLU) |
|---|---|---|
| Direct Food Contact | Filling nozzles, slicer blades, mixing paddles | Under 10–30 RLU |
| Indirect Food Contact | Conveyor guides, equipment housings near product | Under 30–100 RLU |
| Environmental — High Risk Zone | Drains, floor areas near open product lines | Under 100–200 RLU |
| Environmental — General Areas | Walls, non-product-zone equipment exteriors | Under 200–500 RLU |
These ranges are illustrative starting points, not universal standards — actual thresholds should be established through your own validation process, using microbial testing to correlate specific RLU readings with actual contamination risk on your specific surfaces, equipment, and product types. A threshold borrowed from a generic industry guide, without this facility-specific validation step, risks either being too lenient for your actual equipment and process conditions or too strict, generating false failures that erode staff confidence in the testing program and encourage them to disregard results over time.
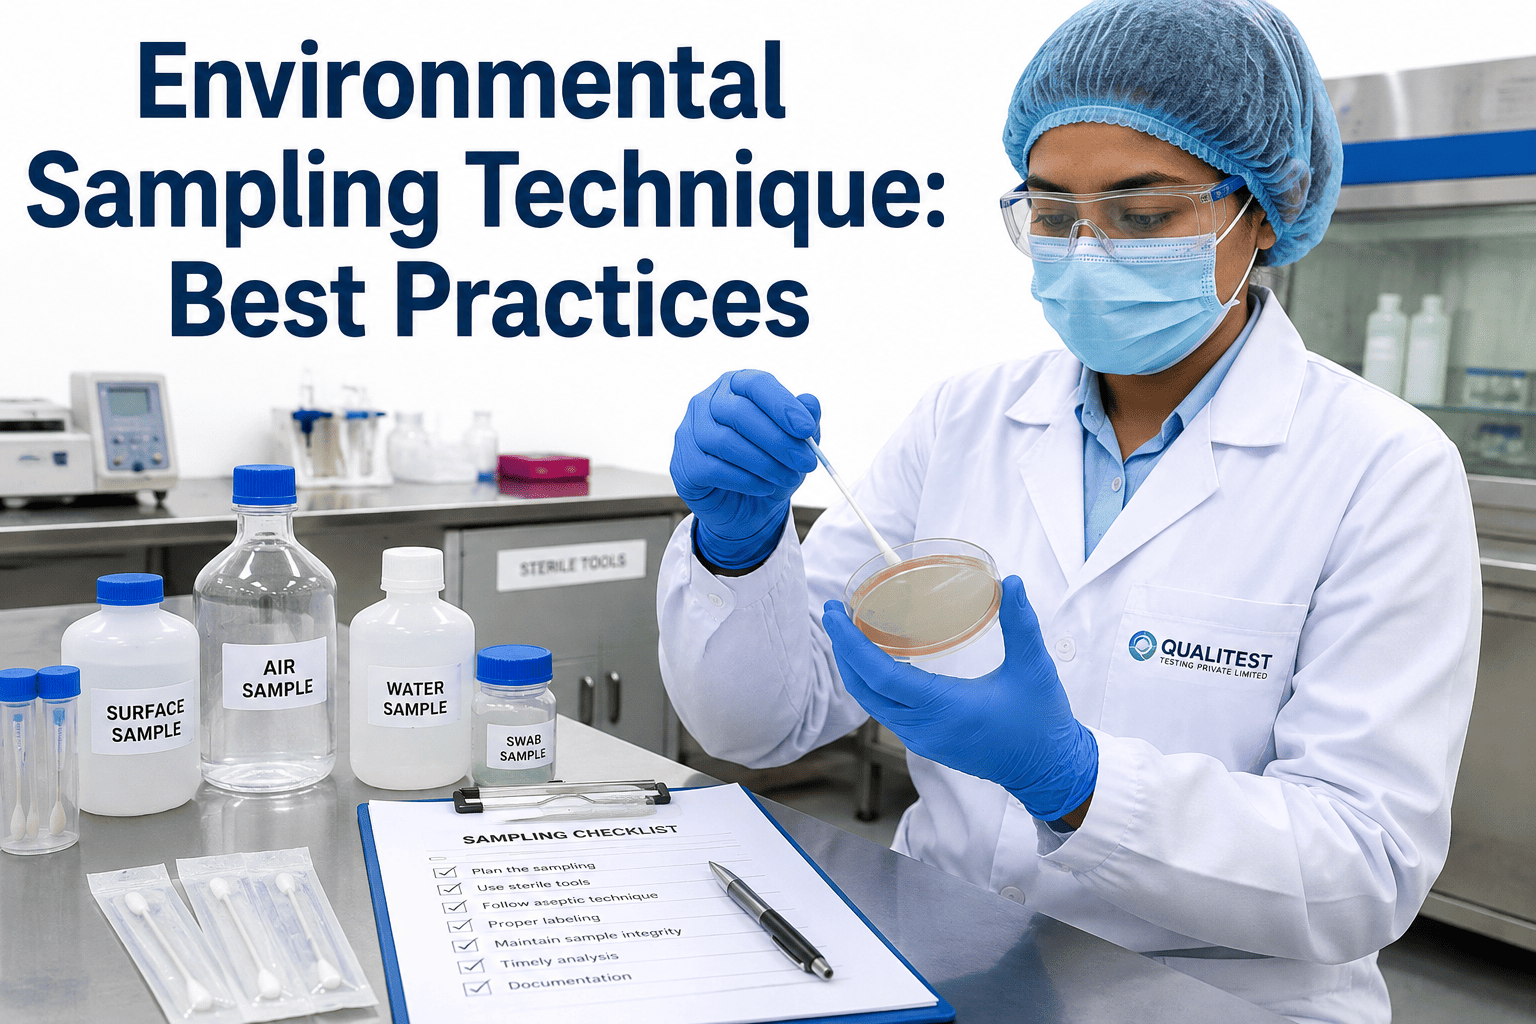
Getting a Reliable Result — Proper ATP Swabbing Technique
An ATP result is only as trustworthy as the swabbing technique behind it. Inconsistent swabbing — different pressure, different swab area, different technique between testers — introduces variability that can make a genuinely clean surface look like a failure, or worse, mask a genuine sanitation gap. This variability is one of the most common and least discussed sources of unreliable ATP data in food plants, since two technicians swabbing the exact same clean surface with different techniques can produce meaningfully different RLU readings, undermining confidence in the entire program if technique isn't standardized and reinforced through training.
Training every tester against a documented, standardized technique — ideally with periodic proficiency checks comparing different testers' results on the same reference surface — is one of the highest-value, lowest-cost investments a sanitation program can make. A facility with excellent thresholds and analysis but inconsistent swabbing technique is building its entire program on an unreliable measurement foundation, no matter how sophisticated the downstream data analysis becomes.
What a Failed Swab Actually Tells You — And What It Doesn't
A failed ATP swab is a signal, not a diagnosis. Understanding what a high RLU reading can and can't tell you is essential to responding appropriately, rather than either over-reacting to noise or under-reacting to a genuine sanitation gap. Teams new to ATP testing sometimes treat a single failed swab as proof of a serious contamination event, triggering disproportionate investigation, while others become desensitized to failures if the response is always the same simple re-clean-and-retest cycle regardless of how often or where failures occur — both extremes miss the actual diagnostic value ATP data offers when interpreted thoughtfully.
This distinction between what ATP confirms and what it doesn't is exactly why a comprehensive food safety verification program layers ATP testing alongside, rather than instead of, other verification methods. ATP is fast and inexpensive enough to run frequently, catching gross sanitation failures immediately, while periodic microbial testing, allergen swabbing, and environmental monitoring programs fill in the specific contamination risks that a rapid organic-residue proxy test was never designed to detect on its own.
Why Trending ATP Data Matters More Than Any Single Result
A single ATP result, whether pass or fail, is a snapshot. The real value of an ATP program emerges from trend analysis — tracking results by location, shift, sanitation crew, and time period to identify patterns that a single test result would never reveal on its own. Facilities that treat ATP purely as a pass/fail gate, discarding results once a location clears, are extracting only a fraction of the value the testing program is capable of providing. Book a demo to see how trend analysis surfaces patterns in your specific sanitation data.
A location that passes consistently for months and then suddenly starts failing intermittently points to a developing issue — worn equipment creating new residue traps, a change in cleaning chemical concentration, a new sanitation crew member needing additional training. A location that passes but shows a gradual upward RLU trend over weeks, even while remaining technically under threshold, often signals a developing sanitation gap that will eventually cross the pass/fail line if left unaddressed. Neither of these patterns is visible from a single pass/fail result — they only emerge when results are tracked and reviewed systematically over time.
What a Mature ATP Program Actually Looks Like Over Time
Facilities running ATP testing for the first year often experience a natural maturity curve — early results tend to run higher than expected as swabbing technique is standardized and equipment cleaning procedures are refined in response to what the data reveals. This initial adjustment period is normal and shouldn't be interpreted as evidence the program isn't working; it's evidence the program is doing exactly what it's designed to do, surfacing sanitation gaps that existed all along but had never been measured before.
As the program matures, the value shifts from simply identifying failures toward using accumulated trend data to make proactive decisions — adjusting cleaning procedures before a location trends toward failure, identifying which sanitation crew members or shifts consistently produce the strongest results and sharing that technique more broadly, and using seasonal or product-changeover pattern data to anticipate where extra sanitation attention will be needed before problems develop. A mature ATP program becomes a continuous improvement tool for the sanitation function overall, not simply a compliance checkbox exercise repeated identically shift after shift.