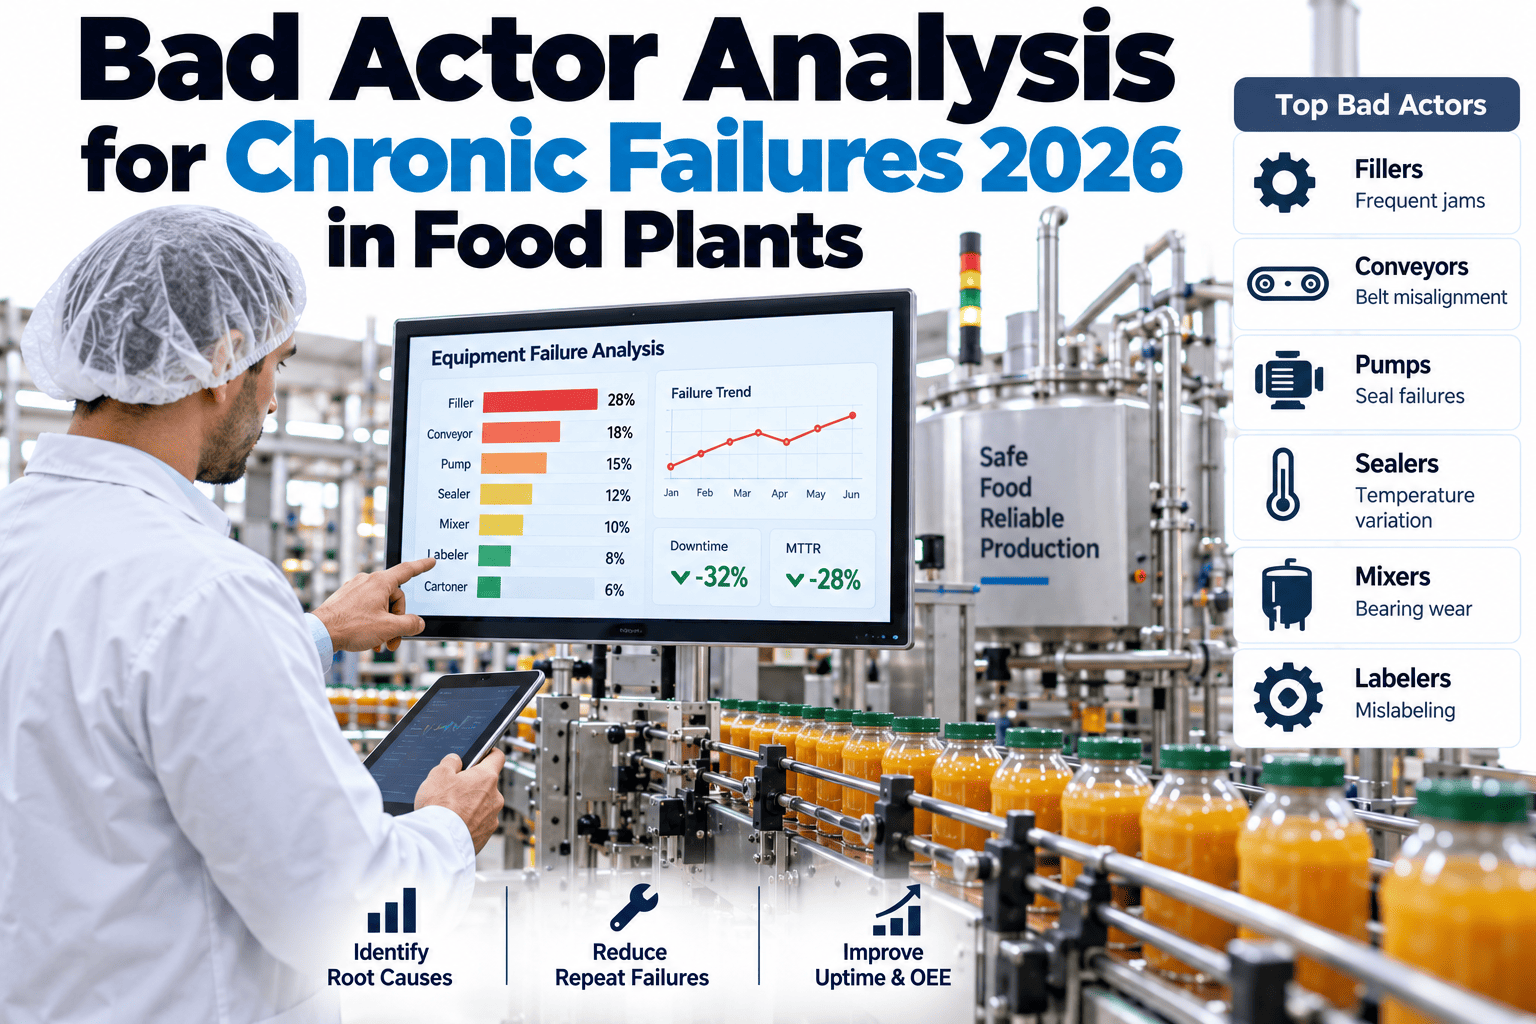
The same filler head jams every few weeks, the same conveyor motor trips on night shift, the same seal weeps after every CIP — and each one gets written up as a brand-new job, fixed in an hour, and forgotten until it happens again. Repeat equipment faults are the most preventable downtime a food plant carries, yet they hide because nobody is counting how many times the same problem has already come back. iFactory AI reads your full fault history and clusters recurring events by asset, part, symptom and shift, so the handful of assets quietly draining your week stop blending in. The fastest way to see where yours are hiding is to map your worst offenders live.
Find the Assets That Keep Failing — Before They Cost You Another Shift
iFactory AI turns scattered work-order history into a live bad-actor ranking, auto-grouping recurring faults across four lenses so the true repeat offenders surface in minutes instead of a two-month spreadsheet hunt.
Why Repeat Failures Hide in Plain Sight
A repeat failure is rarely obvious in the data, because the same physical problem almost never gets logged the same way twice. Two technicians on two shifts describe one fault in two sets of words, and the pattern dissolves into noise long before anyone sees it.
The reliability failure mode is not the machine — it is the record. A chronic asset stays chronic because every repair stops at the physical cause on the day, and the history that would have named the pattern was never assembled into one place.
Five Signs You Already Have a Hidden Bad-Actor Problem
Most plants carry a handful of repeat offenders long before anyone names them. You rarely need a report to feel it — the signals show up in the way the floor talks and the way the storeroom moves. If three or more of these sound familiar, the pattern is already costing you.
The same asset lands in the breakdown log more than a couple of times a quarter, and nobody can say why it keeps coming back.
Technicians say "oh, that one again" before they have even opened the work order — the crew already knows the repeat offenders by name.
A spare part leaves the storeroom far more often than its install base should ever need, so the failure is following the part, not the machine.
One line or one shift reports a fault the others never see, which points at a changeover or a handling habit rather than the equipment itself.
An asset marked "fixed" is back on the breakdown board within weeks, a sure sign the last repair treated the symptom and missed the cause.
None of these needs new sensors to spot — the evidence is already in your maintenance history. What is missing is the one view that counts the recurrences and ranks them, instead of letting each event close as an unrelated job.
The Four Lenses That Expose the True Bad Actor
Un-hiding a repeat failure means looking at the same events from four directions at once. Any single lens can miss a bad actor; together they corner it. iFactory AI groups every fault event along all four and watches for the clusters a human eye skims past.
By Asset
Roll every event up to the specific machine — filler head, metal detector, ammonia compressor — and rank which units carry the most failures and the most lost hours. This is the Pareto view: a small share of assets usually owns most of the downtime.
By Part
Group by the component that actually gave out — a bearing, a drive belt, a seal, a sensor. When the same part fails across several machines, the real issue is a spec, a supplier or an install practice, not one unlucky asset.
By Symptom
Cluster by failure mode — overheating, vibration, tripping, leaking — so that differently-worded notes describing one behaviour collapse into a single pattern. This is the lens that defeats inconsistent free-text descriptions.
By Shift & Crew
Compare failure rates by shift, day and crew. A fault that clusters on one shift points away from the machine and toward a changeover, a cleaning step or a loading habit the equipment is reacting to.
See Your Own Repeat Offenders Ranked
Bring a year of work-order history to a 30-minute session and iFactory AI will cluster it across all four lenses and show you the bad-actor board for your own lines — live, on your data.
What Actually Qualifies as a Bad Actor
Not every machine that breaks is a bad actor. The distinction is repetition of the same failure mode despite repair, concentrated in a few assets that eat a disproportionate share of maintenance hours. A widely used reliability rule flags any asset with three or more unplanned failures in a rolling two-year window, or two within six months, and the ranking matters more than the raw count — the goal is to work the worst first.
| Asset / Line | Repeat events (24 mo) | Downtime hours | Sanitation re-runs | Bad-actor score |
|---|---|---|---|---|
| Filler Head 3 — Line B | 7 | 41 | 7 | High |
| Blancher Conveyor Drive | 5 | 33 | 2 | High |
| Case Packer Vacuum Pump | 4 | 18 | 0 | Medium |
| Metal Detector — Pack Line 2 | 3 | 9 | 3 | Medium |
| CIP Supply Pump | 3 | 6 | 0 | Watch |
Illustrative ranking. A good score blends frequency, lost hours and knock-on cost — a metal detector that fails three times and forces three sanitation re-runs outranks a pump that fails three times with no food-safety impact. The score is what turns a long list into a short, ordered worklist.
Chronic vs Sporadic — Which Failures to Chase First
Reliability teams split failures into two families, and repeat-failure detection is aimed squarely at one of them. Knowing the difference stops you from pouring investigation hours into the wrong events — and explains why bad-actor work is often the fastest reliability win available to a food plant.
The trap is treating a chronic failure like a sporadic one — shrugging off each small recurrence as bad luck. Counted together, those "small" events are usually the single largest bucket of recoverable downtime in the plant, and they are the ones a detection engine is purpose-built to surface.
Detection Finds It. Diagnosis Fixes It.
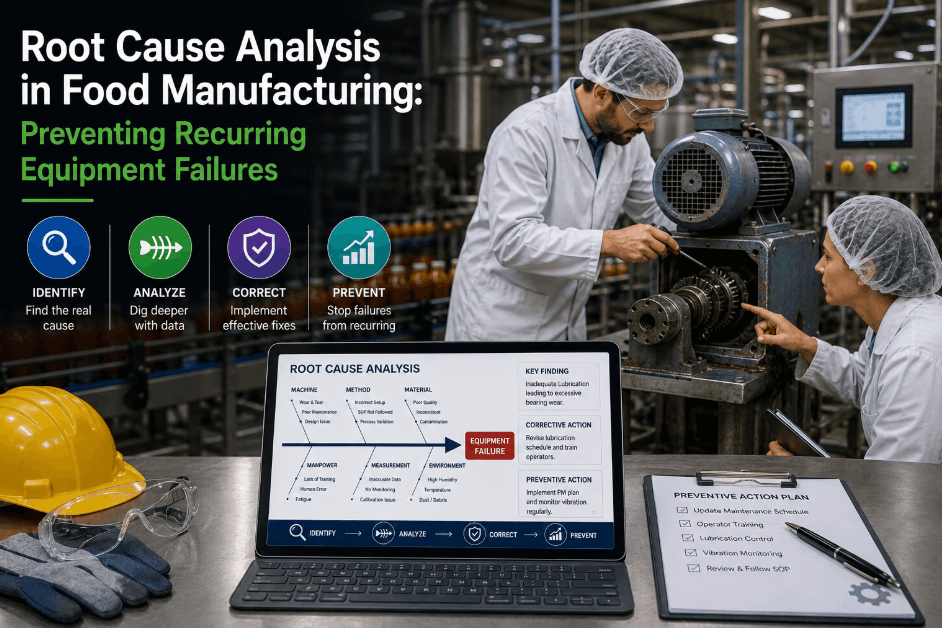
Software that surfaces and ranks bad actors is doing half the job — the valuable half most plants never get to, because the pattern was buried. But detection is honest about its limits: it points reliability effort at the right asset. The fix still comes from a proper root-cause investigation, and the loop only closes when you prove the fix held.
Cluster every fault event across the four lenses and flag assets that cross the repeat threshold — automatically, at the second occurrence, not at year-end.
Order the bad actors by combined frequency, downtime and food-safety cost so the team always works the one asset with the most to give back.
Route the top offender into a structured root-cause analysis with its full event history attached, so the investigation starts from evidence, not memory.
Watch mean time between failures after the fix. If the asset fails again, the detection engine re-flags it — the finding never just sits in a closed report.
The reason most repeats persist is not that nobody found the cause — it is that the fix addressed the broken part, not the reason the part keeps breaking. A bad actor that comes back after a repair is the clearest signal that the last investigation stopped one layer too shallow.
A Composite Scenario: The Filler Head That Hid Behind Three Shifts
A ready-meals plant kept losing its primary filler to a recurring vacuum-seal fault, but no one had ever counted the events as one problem. Days logged it as "seal weeping," nights as "vacuum low," and the weekend crew as "pump playing up" — three descriptions, three closed jobs, three unrelated-looking entries every month. Clustered by symptom and rolled up to the asset, the pattern was undeniable: seven failures in twenty-four months, every one the same root behaviour, every one forcing a full sanitation cycle before the line could restart. A single root-cause review traced it to a seal spec that could not take the night-shift changeover rhythm, and one part change ended the cycle that six separate repairs had never touched.
Why a Repeat Failure Costs More in a Food Plant
In general manufacturing, a repeat failure costs the repair plus the lost production. In a food plant, one failure on food-contact equipment pulls several clocks at once — which is exactly why letting the same fault recur is so much more expensive than the work order suggests, and why it is worth the time to bring your work-order history into one place.
A full sanitation cycle
Any intervention on food-contact equipment usually triggers a complete clean-down before restart. The repeat fault doesn't just stop the line — it adds a sanitation run every single time it recurs.
Product in the line
Work in progress at the moment of the stop is often scrapped on hygiene or quality grounds. Multiply that by every recurrence and the material loss dwarfs the labour on the job card.
Hold and re-qualification
A failure on HACCP-critical equipment — a metal detector, a cook step, a seal — can put output on hold pending checks, turning a short mechanical fault into hours of blocked product.
Line clearance and restart
Getting back to validated running conditions after an unplanned stop takes documented checks and ramp time. That restart tax is paid in full on every repeat, not amortised.
The same fault at the next plant
A latent cause rarely lives at one site. The same gearbox or seal failure quietly repeats on the identical line at a sister facility — counted as isolated incidents until someone matches them.
Audit exposure
A recurring failure with no documented root cause is a weak spot an auditor can find. Clean failure history and a closed-loop fix record are part of the compliance story, not just the maintenance one.
What to Look For in Repeat-Failure Detection Software in 2026
"Best" is the software that turns messy history into an ordered worklist and keeps it honest after the fix. When you compare options for a food operation, weigh them against these six capabilities rather than feature-count.
Clusters across all four lenses
Asset, part, symptom and shift — not asset alone. Single-lens tools miss the bad actors that hide behind component spec or crew behaviour.
Reads messy free text
It should pull patterns from inconsistent, differently-worded notes, not demand perfect failure codes on day one. Real history is messy.
Flags at the second event
A repeat should surface the moment it recurs, not in a quarterly review. Early flags are what let you intervene before the third and fourth hit.
Ranks by real cost
Frequency plus downtime plus food-safety impact — so a fault that forces sanitation re-runs is weighted above one that doesn't.
Verifies the fix held
It should track mean time between failures after each repair and re-flag any asset that fails again, closing the loop on the investigation.
Matches patterns across sites
For multi-plant operators, the same failure at two facilities should connect, so one root-cause fix can be rolled out everywhere it applies.
Where iFactory AI Fits
iFactory AI is a smart-manufacturing analytics platform built for industrial reliability, and repeat-failure detection is one of the jobs it is purpose-built to do on food and beverage lines. It reads the history you already have and keeps the bad-actor picture current as new events come in.
Automatic four-lens clustering
Every fault event is grouped by asset, part, symptom and shift at once, turning years of differently-worded work orders into clean, comparable patterns without a manual re-coding project.
A live bad-actor ranking
The repeat-offender board refreshes as events land, so the top of the list is always the asset with the most downtime and food-safety cost to recover right now — no spreadsheet rebuild.
MTBF tracked after every fix
Mean time between failures is measured per asset before and after each repair. A fix that didn't hold re-triggers analysis automatically, so a recurring problem can't quietly slip off the radar.
Cross-line and cross-site matching
The same failure on identical equipment at different lines or plants is connected rather than counted twice, so one root-cause fix is replicated everywhere the latent cause lives.
iFactory AI arrives pre-configured on an NVIDIA AI server that ships racked and ready with the software pre-loaded. Rack it, connect power and Ethernet, and the detection engine is live. The rollout covers cabling, network, PLC and SCADA integration, operator training, and 24×7 remote monitoring — so the bad-actor board is running on your real failure history, not a demo dataset.
Frequently Asked Questions
How many failures before an asset counts as a repeat offender?
A common reliability rule of thumb flags any asset with three or more unplanned failures in a rolling two-year window, or two within six months, as a bad actor worth investigating. The exact threshold matters less than consistency — pick one, apply it to every asset, and let the ranking by frequency and cost decide which bad actor the team works first. The point is to stop treating each recurrence as a fresh, isolated job.
Our work orders are messy free text. Will detection still work?
Yes — that is exactly the problem it is built for. Clustering by symptom collapses differently-worded notes describing the same behaviour into one pattern, so "vacuum low," "seal weeping" and "pump broken" on the same asset are recognised as one recurring fault rather than three unrelated ones. Structured failure codes make the picture sharper over time, but you do not need a clean, fully-coded history before you can start finding your worst repeat offenders.
Does the software fix the failure, or just find it?
It finds, ranks and keeps watch — it does not replace the root-cause investigation. Detection points reliability effort at the right asset with its full history attached, so the fix starts from evidence instead of memory. The engineering judgement and the actual repair are still yours; the software's job is to make sure the right asset gets that attention, and to re-flag it if the fix doesn't hold. You can see that loop on your own data in a 30-minute walkthrough.
Why does a repeat failure cost more in a food plant specifically?
Because one failure on food-contact equipment pulls several clocks at once. Alongside the lost production, the intervention usually forces a full sanitation cycle before restart, scraps whatever product was in the line, and can put output on hold if the asset is HACCP-critical. Those costs are paid in full on every single recurrence, which is why the real price of tolerating a bad actor is far higher than the hours on the job card.
How soon will we see results after going live?
The bad-actor ranking is useful from the first history load, because the patterns are already in your data waiting to be assembled. The deeper payoff follows the first few root-cause fixes on the top-ranked assets, and then compounds as mean time between failures is tracked after each one. Many teams see recurring failures measurably decline within the first few months of working the list in order rather than reacting event by event.
Stop Paying for the Same Failure Twice
iFactory AI clusters your recurring faults across asset, part, symptom and shift, ranks the true bad actors, and verifies every fix held. Book a walkthrough to see your own repeat-fault board built live on your history.