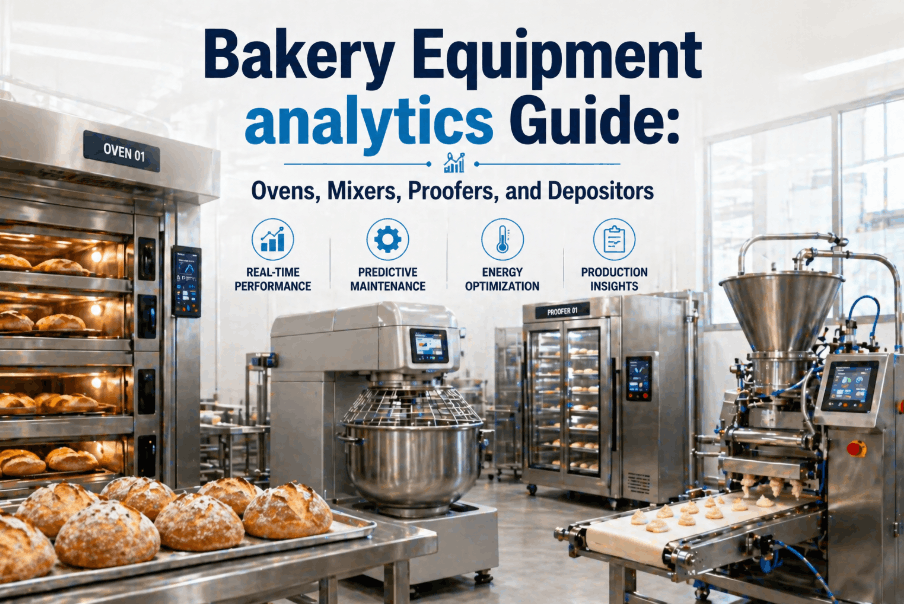
Bakery equipment analytics is transforming how commercial bakeries manage production uptime, reduce waste, and maximize throughput across every critical asset class. Industrial ovens, planetary mixers, spiral mixers, proofers, depositors, dividers, and cooling conveyors each carry distinct failure modes, sanitation requirements, and performance degradation patterns — and operations managers who rely on manual inspection and reactive maintenance schedules are systematically leaving yield, capacity, and compliance on the table. This guide delivers a complete bakery equipment analytics framework, covering PM schedules, sanitation requirements, and AI-driven monitoring strategies for every major asset in a commercial bakery production environment. If you're ready to move from spreadsheet-based maintenance logs to real-time equipment intelligence, Book a Demo to see how AI-driven bakery equipment analytics delivers measurable results from your first production week.
Why Bakery Equipment Analytics Is a Production Imperative in 2026
The Hidden Cost of Reactive Maintenance in Commercial Bakery Operations
Most commercial bakeries still operate on fixed-interval PM schedules designed for asset populations, not individual equipment health trajectories. A spiral mixer running high-hydration doughs degrades faster than one processing lean formulations — yet both receive the same maintenance interval under a calendar-based schedule. The result is a systematic mismatch between maintenance investment and actual asset condition that drives unplanned downtime, premature part replacement, and compliance risk from degraded sanitation outcomes. Bakery production analytics closes this gap by converting machine state signals, process parameter streams, and quality sensor data into actionable asset intelligence. Operations managers who have deployed AI-driven bakery equipment monitoring consistently report 40–60% reductions in unplanned downtime events within two operational quarters — without capital equipment replacement or line modification.
Industrial Oven Analytics: Temperature Uniformity, Burner Health, and Bake Consistency
Critical Monitoring Parameters and PM Schedule for Commercial Tunnel and Rack Ovens
Industrial tunnel ovens and rack ovens are the highest-criticality assets in any commercial bakery production line — and the most analytically complex. Temperature uniformity across baking zones directly determines product colour consistency, moisture retention, and regulatory compliance on declared weights. Burner degradation, conveyor belt sag, steam injection valve drift, and damper actuator wear all contribute to temperature profile shifts that accumulate gradually and are invisible to manual inspection until product quality failures force a line stop. AI-driven industrial oven analytics monitors zone temperature deviation in real time, correlates burner firing patterns with thermocouple signals, and generates predictive alerts when temperature uniformity trends toward specification limits — giving maintenance teams intervention lead time measured in shifts rather than hours. Bakeries evaluating oven monitoring solutions can Book a Demo for a live thermal analytics demonstration.
| Oven Asset Component | Monitoring Parameter | PM Interval | Failure Mode | AI Analytics Lever |
|---|---|---|---|---|
| Burner Assembly | Flame pattern, fuel-air ratio | Every 500 production hours | Uneven bake, colour deviation | Combustion efficiency trending |
| Conveyor Belt / Band | Belt tension, sag index, tracking | Weekly visual + monthly tension check | Product jamming, uneven bake floor | Belt tension anomaly detection |
| Zone Thermocouples | Zone temperature uniformity (±5°C) | Calibration every 90 days | Bake variance, compliance failure | Thermocouple drift pattern alerts |
| Steam Injection System | Steam pressure, injection cycle timing | Monthly valve inspection | Crust defects, product weight loss | Steam cycle performance trending |
| Exhaust Damper Actuators | Damper position vs. setpoint | Quarterly actuator check | Humidity imbalance, condensation | Actuator response lag detection |
| Drive Chain and Bearings | Vibration signature, motor current | Monthly lubrication, quarterly inspection | Conveyor stoppage, product loss | Vibration-based bearing health model |
Mixer Analytics: Spiral and Planetary Mixer Health Monitoring for Bakery Production
Dough Development Consistency, Motor Load Tracking, and Mixer PM Schedules
Commercial mixer analytics addresses one of the most undermonitored loss categories in bakery production: dough development variance driven by mixer degradation. Spiral mixers processing high-hydration artisan doughs and planetary mixers running laminated pastry formulations both exhibit predictable degradation patterns — gear wear increasing torque variability, bowl seal deterioration introducing contamination risk, and hook or paddle wear altering dough development curves. When mixer condition degrades silently, the quality impact appears downstream at the proofer or oven — where root cause attribution to mixer performance is nearly impossible without longitudinal motor current and torque data. AI-driven mixer analytics captures motor current draw per batch, correlates deviations with dough temperature and hydration variables, and builds a baseline development profile that flags when mixer health is affecting product consistency. Operations teams can Book a Demo to see batch-level mixer performance analytics in action.
Proofer Analytics: Humidity, Temperature, and Fermentation Consistency Monitoring
How AI Proofer Monitoring Eliminates Fermentation Variance and Compliance Risk
Proofer analytics is the most underinvested monitoring category in commercial bakery operations — despite the fact that fermentation environment instability is one of the leading drivers of product yield loss and inconsistency. Industrial tunnel proofers and rack proofers depend on precise humidity and temperature maintenance across the full fermentation zone to deliver consistent dough volume, cell structure, and bake-ready product quality. Humidity sensor calibration drift, steam injection valve cycling failures, and zone temperature variance from degraded heating elements all introduce fermentation inconsistency that appears as irregular oven spring, volume variance, and colour deviation at the end of the bake. AI-driven proofer analytics monitors zone humidity and temperature in real time, detects sensor drift through cross-validation against adjacent zone readings, and generates predictive alerts for steam injection system degradation before fermentation outcomes are affected. Bakery production managers can Book a Demo to benchmark their proofer monitoring maturity.
Depositor and Divider Analytics: Fill Accuracy, Portioning Consistency, and Yield Optimization
Reducing Fill Weight Variance and Portion Loss Through Real-Time Depositor Monitoring
Depositor analytics and divider analytics address the highest-density yield loss opportunity in commercial bakery production. Fill weight overage on high-volume depositor lines represents 1.5–4% of total raw material cost — a compounding yield loss that accumulates invisibly across every production shift. Rotary depositors, piston depositors, and dough dividers all exhibit characteristic wear patterns that manifest as fill weight variance, portioning inconsistency, and cycle timing drift. Worn piston seals on depositor cylinders introduce shot-to-shot volume variability. Divider blade wear alters dough piece weight distribution across the portioning cycle. Pump cavitation on liquid depositors creates aeration-driven fill inconsistency that is invisible to post-pack checkweigher sampling rates. AI depositor analytics integrates inline fill weight data from checkweighers with depositor cycle parameter streams — attributing fill variance to specific mechanical conditions rather than leaving operations teams with a weight distribution report and no root cause. Facilities can Book a Demo to model the yield recovery value applicable to their depositor line configuration.
Cooling Conveyor Analytics: Product Temperature Compliance and Throughput Optimization
Monitoring Cooling Uniformity, Belt Integrity, and Sanitation Compliance on Bakery Cooling Lines
Cooling conveyor analytics is the final critical monitoring domain in a complete commercial bakery equipment analytics program. Cooling conveyors determine the product temperature at packaging entry — a food safety parameter with direct regulatory implications for wrapped goods shelf life and contamination risk. Insufficient cooling before wrapping drives condensation-related mould risk and packaging seal integrity failures. Cooling conveyor analytics monitors product exit temperature in real time across the full belt width, detects airflow distribution failures from degraded fan blades or blocked duct sections, and identifies belt tension irregularities that affect product travel and spacing. Sanitation monitoring for cooling conveyors — the longest surface area of any bakery asset and the most exposed to post-bake airborne contamination — requires automated hygiene inspection scheduling tied to production run hours rather than fixed calendar intervals.
Bakery Equipment Sanitation Analytics: Compliance-Driven Hygiene Scheduling
Using AI Analytics to Optimize CIP and Dry Cleaning Schedules Across Bakery Asset Classes
Bakery equipment sanitation analytics converts hygiene compliance from a fixed-schedule cost centre into an intelligence-driven production resource. Traditional bakery sanitation programs operate on calendar-based intervals designed to satisfy audit requirements — not to reflect the actual contamination accumulation profile of individual assets under varying production conditions. A depositor running high-sugar formulations accumulates residue faster than one processing lean dough — but both receive the same cleaning interval. AI sanitation analytics integrates production run data, formulation type, and contamination proxy measurements to generate risk-adapted cleaning triggers that maintain full GFSI compliance while compressing unnecessary sanitation downtime by 15–25%. Facilities evaluating sanitation analytics solutions can Book a Demo to see a contamination risk model applied to their specific asset portfolio and production schedule.
Frequently Asked Questions: Bakery Equipment Analytics
What bakery equipment types benefit most from AI-driven analytics monitoring?
Industrial ovens deliver the fastest ROI through temperature uniformity monitoring, while depositors and dividers offer the highest yield recovery through fill weight variance reduction. All five asset categories — ovens, mixers, proofers, depositors, and cooling conveyors — show measurable improvement within the first two operational quarters.
How does AI bakery equipment analytics improve PM schedule efficiency?
AI condition-based PM scheduling replaces fixed calendar intervals with maintenance triggers tied to actual asset condition — motor current trends, vibration signatures, and production run hours. Facilities consistently achieve 20–35% reductions in total PM labour hours while simultaneously reducing unplanned breakdown frequency.
Can bakery equipment analytics integrate with existing ERP and MES systems?
Yes. AI platforms integrate bi-directionally with SAP, Oracle, Microsoft Dynamics, and leading MES systems through standard API and OPC-UA interfaces. Implementation for a facility with four to ten monitored assets typically runs four to seven weeks from kickoff to live dashboards with zero production interruption.
What sensor infrastructure is required for bakery equipment analytics deployment?
Ovens and proofers use existing thermocouples and humidity sensors as the primary data feed with no additional hardware. Mixers and depositors typically require low-cost motor current transducers and vibration sensors on priority assets. Most facilities achieve 70–80% monitoring coverage using existing infrastructure.
How does bakery equipment analytics support GFSI and BRC food safety compliance?
AI analytics generates automated, timestamped records of equipment condition, sanitation cycle completion, and parameter compliance — replacing manual log entries entirely. Oven zone temperatures, proofer humidity logs, and CIP completion data are captured automatically and formatted for direct audit submission.
Does bakery equipment analytics require replacing existing production equipment?
No. Analysis consistently shows that 65–75% of recoverable losses in commercial bakery operations are addressable through operational improvements on existing assets — without capital equipment replacement. AI analytics delivers payback periods under 14 months across the majority of commercial bakery deployments.