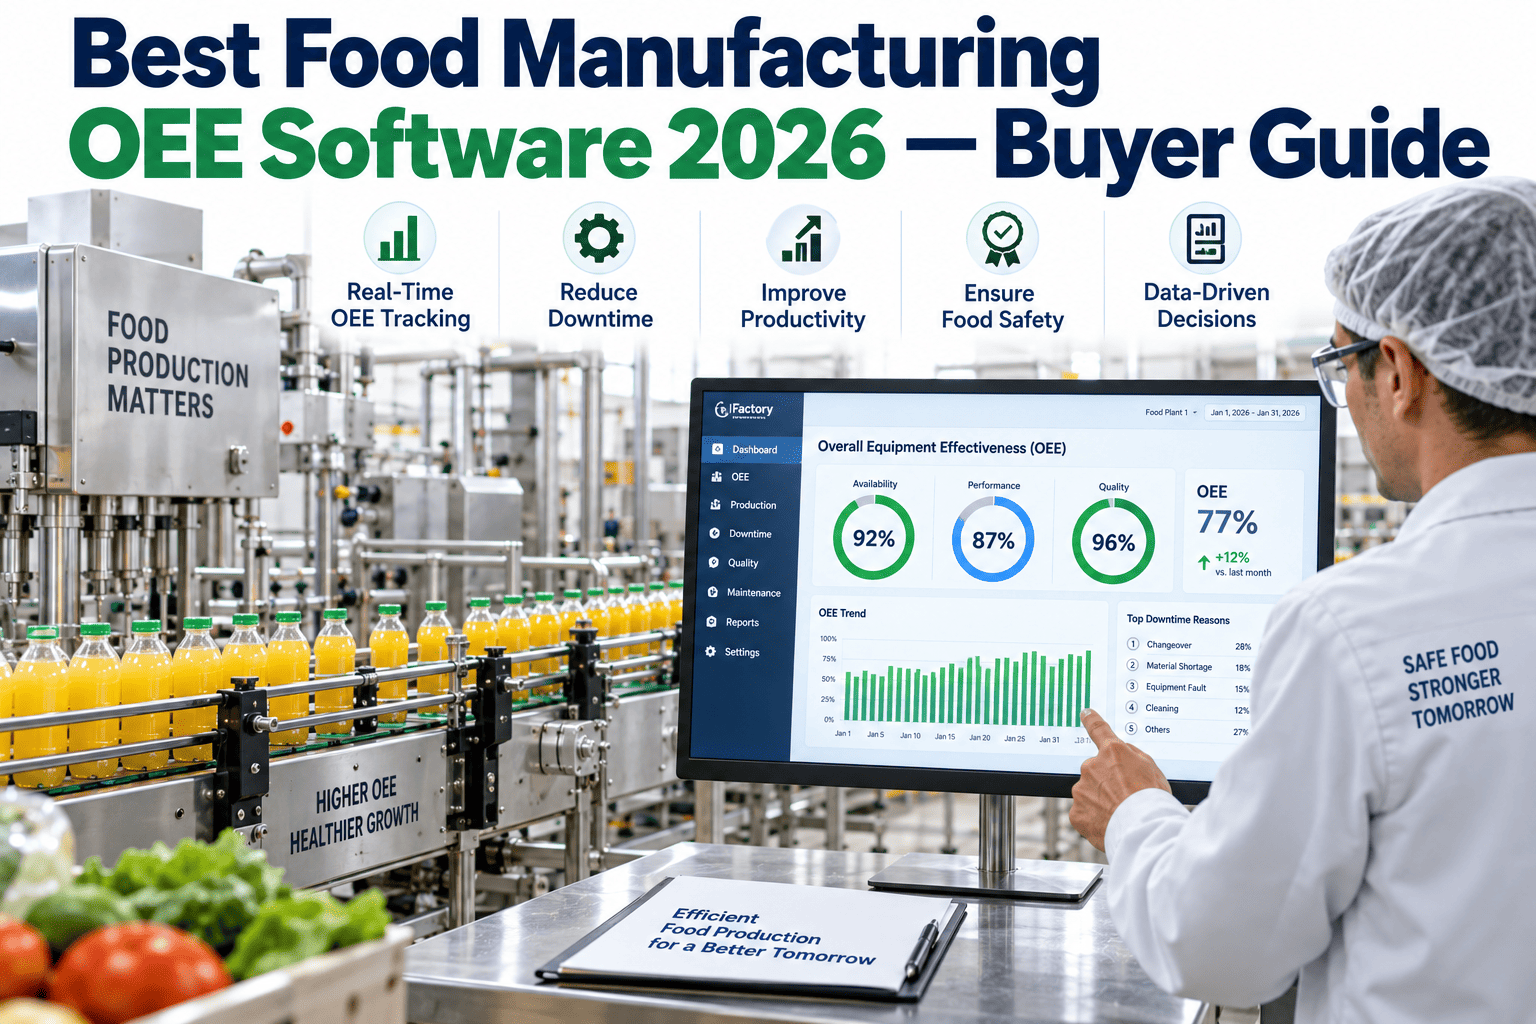
Most plants that install OEE software for the first time get a number that's uncomfortable to look at: measured performance typically lands fifteen to twenty-five points below what management estimated before a system was actually tracking it, and the gap almost never comes from a single dramatic cause. It comes from micro-stoppages under thirty seconds that a manual log never catches, from Clean-in-Place cycles that run longer than standard without anyone noticing the overrun, and from changeovers that routinely exceed their target time by fifteen to forty percent. A generic OEE tool built for discrete manufacturing handles almost none of this correctly, because CIP and allergen changeovers simply don't exist as a concept on a general-purpose factory floor. If you're evaluating OEE software right now, book a demo to see what a food-specific evaluation checklist actually looks like.
FOOD & BEVERAGE · OEE SOFTWARE BUYER GUIDE 2026
The Formula Is Simple, Getting It Right in Food Isn't
iFactory captures Availability, Performance, and Quality automatically and correctly for food and beverage lines, CIP-aware, changeover-aware, and built to catch every micro-stop a manual log misses.
WHY FOOD OEE IS DIFFERENT
Three Things Generic OEE Tools Get Wrong
OEE as a concept was built for discrete, dry manufacturing, and applying it directly to a food or beverage line without adapting for these three realities produces a number that looks precise but means very little.
CIP Isn't Downtime, Until It Runs Long
Clean-in-Place is planned downtime and shouldn't count against availability, but the actual duration varies widely, a standard cycle might run 45 minutes while a post-allergen deep clean runs 3 hours, and only the overrun beyond standard should count as a loss.
Micro-Stops Are the Biggest Loss Category
On a high-speed filling or labeling line, stops under thirty seconds, a label misfeed, a cap jam, a bottle tip-over, happen constantly and are too frequent and too brief for manual logging, yet they routinely account for roughly half of total lost efficiency.
Allergen Changeovers Aren't Just a Swap
A changeover between allergen-declared products requires a full line flush and sanitation validation, not just a mechanical reconfiguration, and actual changeover time routinely exceeds standard by fifteen to forty percent when this isn't tracked precisely.
THE EVALUATION CHECKLIST
What to Actually Demand From an OEE Platform
✓Automated, sub-second data capture, not manual operator logging
✓Configurable CIP event categories treated as planned or unplanned by type and duration
✓Allergen and SKU changeover tracking measured against a defined standard time
✓Non-intrusive, GMP-compliant sensor installation with no food-contact surface modification
✓Product-level OEE across a multi-SKU line, not one blended plant-wide number
✓Direct link from a loss event to a maintenance work order, not a standalone dashboard
See your real OEE baseline before you buy anything
iFactory can run a short measurement window on your line and show you your actual, automated OEE score against your current estimate.
THREE CATEGORIES OF OEE TOOLS
Understanding What Kind of Platform You're Actually Comparing
Most OEE platforms on the market fall into one of three broad categories, and knowing which category a vendor belongs to tells you more about fit than any single feature checklist.
Scoreboard & Culture Tools
Strong for visualizing team performance and motivating shift-to-shift competition, but typically weak on connecting a loss event to an actual root cause or repair action.
Connectivity-First Platforms
Good at pulling data off legacy or hard-to-reach equipment, but often leave you to build the food-specific logic, CIP handling, allergen tracking, yourself.
Maintenance-Native Platforms
Built to connect OEE loss data directly to the maintenance system, so a repeat micro-stop or a chronic changeover overrun turns into an actionable, trackable work order rather than just a number on a screen.
The right category depends on what your plant actually needs most, a scoreboard to drive team engagement, a way to connect to equipment nobody's instrumented yet, or a system that turns loss data directly into fixed problems. Most food and beverage plants get the most durable value from the third category, since a number without a path to action tends to lose attention within a few months.
GENERIC DASHBOARD VS MAINTENANCE-LINKED OEE
What Changes When the Number Leads to a Fix
| Factor |
Generic OEE Dashboard |
Maintenance-Linked OEE |
| Micro-stop capture |
Often undercounted without sub-second capture |
Captured automatically at sub-second precision |
| CIP handling |
Frequently distorts availability if handled poorly |
Configurable planned vs unplanned treatment by type |
| Root cause visibility |
A number with no path to explanation |
Correlated against SKU, shift, and maintenance history |
| Repeat loss patterns |
Rediscovered manually, if at all |
Flagged automatically and routed to a work order |
| Sustained engagement |
Often fades once the novelty wears off |
Sustained because the data drives real fixes |
TURNKEY DEPLOYMENT
How iFactory Gets Your Lines Measuring Correctly
What Gets Built
Non-intrusive sensor installation across priority lines, no food-contact modification
CIP and changeover event categories configured to your actual standards
Product-level OEE tracking across every SKU your line runs
Direct linkage from repeat loss events into your maintenance work order system
A leadership dashboard alongside floor-level scoreboards
Rollout Timeline
Weeks 1-2: Line audit and sensor installation
Weeks 3-4: CIP, changeover, and SKU configuration
Week 5: Baseline OEE established, dashboard go-live
FREQUENTLY ASKED QUESTIONS
What Plants Ask While Evaluating OEE Software
Why does our current OEE estimate look so different from what a real system measures?
This is an extremely common experience, since a food manufacturer's first automated OEE measurement typically lands fifteen to twenty-five points below what management had estimated based on manual tracking, and the gap almost always comes from the same two sources, undercounted micro-stoppages that are too brief and too frequent for manual logging, and changeover or CIP durations that run longer than standard without anyone noticing the overrun in real time. The number feels alarming at first, but it's actually the more accurate baseline, and it's the starting point every genuine improvement plan should be built from.
Book a demo to see how your current estimate compares to an automated baseline.
Can OEE sensors actually be installed without creating a food safety or contamination risk?
Yes, this is a solvable and well-established requirement rather than a genuine obstacle, and the standard-compliant approach uses non-intrusive sensors, current clamps and external monitoring devices that attach without any modification to food-contact surfaces or the creation of mounting points that could trap contamination. Any vendor proposing a sensor installation that requires modifying equipment in a way that touches product-contact surfaces should be a red flag during evaluation, since GMP-compliant installation is achievable and should be a baseline requirement, not an advanced feature.
Contact our support team to review installation requirements for your specific line.
What's a realistic OEE target once we're measuring accurately?
World-class OEE for high-speed food and beverage packaging and filling lines typically falls in the 75-85% range, though the realistic target for your specific line depends heavily on product type, line speed, and SKU complexity, a line running dozens of SKU changeovers per week faces a structurally different ceiling than one running a single product continuously. The more useful early goal isn't hitting a specific target number immediately, it's establishing an accurate baseline and then tracking consistent improvement against your own historical trend rather than chasing an industry benchmark that may not perfectly fit your product mix.
Book a demo to discuss a realistic target range for your specific line type.
How is CIP time actually kept from distorting our availability number?
The correct approach configures a standard duration for each CIP event type, a routine daily cycle versus a full allergen deep clean, and treats that standard duration as planned downtime excluded from the availability calculation, while any time beyond that standard gets flagged as an availability loss worth investigating. A food line running a consistent five-minute overrun on a twenty-minute standard CIP cycle is losing real production time that a system without this configurable distinction would either hide entirely inside "planned downtime" or incorrectly count against availability for the full duration every time.
Contact our support team to configure CIP categories against your specific sanitation standards.
Does OEE data actually need to connect to our maintenance system, or is the score enough on its own?
A score on its own tells you that a problem exists, but it doesn't tell you what to do about it, which is exactly why a repeat micro-stop pattern or a chronically overrunning changeover needs a direct path into a work order rather than living only as a number on a dashboard that fades from attention within a few months. Plants that connect OEE loss events directly to their maintenance workflow are the ones that see sustained improvement over time, since the data drives an actual fix rather than simply documenting the same recurring loss month after month.
Book a demo to see how a loss event routes into an actionable work order.
EVERY SKU, EVERY MICRO-STOP, EVERY CIP CYCLE
Measure OEE the Way a Food Line Actually Runs
iFactory captures Availability, Performance, and Quality automatically, CIP-aware, changeover-aware, and connected directly to the maintenance work that actually improves your score.