Beverage production equipment analytics is redefining how plant engineers manage filling lines, carbonation systems, tunnel pasteurizers, and bottling operations. In a high-throughput environment where a single unplanned stoppage on a filler can cost tens of thousands of dollars per hour, the shift from reactive maintenance to AI-driven predictive intelligence is no longer optional — it is a competitive baseline. This guide delivers the operational framework, equipment-specific PM schedules, and analytics architecture that beverage plant engineers need to maximize line efficiency, protect product quality, and meet tightening compliance standards across every production stage. To see how AI-driven beverage equipment analytics performs on a live bottling or filling line, Book a Demo with our manufacturing intelligence team today.
Why Beverage Production Equipment Analytics Is Critical in 2026
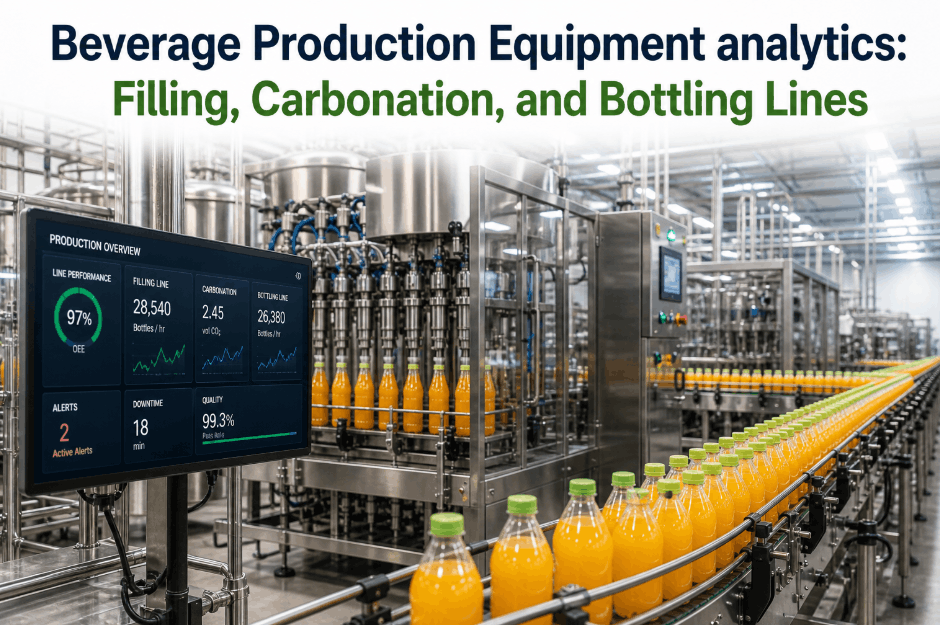
The Operational Stakes for Filling, Carbonation, and Bottling Line Performance
Modern beverage plants operate under simultaneous pressure from three directions: consumer demand for SKU variety drives frequent changeovers, sustainability mandates compress energy and water budgets, and food safety regulators demand traceable documentation across every production stage. Traditional preventive maintenance schedules built on fixed calendar intervals cannot respond to the real-time asset degradation patterns that high-speed carbonation systems, rotary fillers, and tunnel pasteurizers generate under variable load conditions. Beverage production equipment analytics closes this gap by applying machine learning models to continuous sensor streams — delivering failure predictions, CIP optimization signals, and carbonation deviation alerts that maintenance teams can act on before quality or uptime is compromised.
Filling Machine Analytics: Predictive Maintenance for Rotary and Linear Fillers
Filling Machine PM Schedules and AI-Driven Failure Detection
Filling machines — whether rotary gravity fillers, isobaric counter-pressure fillers for carbonated beverages, or linear piston fillers for viscous products — are the highest-value, highest-risk assets on any bottling line. Fill valve seal wear, carousel bearing degradation, and flow meter drift are the three most common failure modes that drive unplanned downtime, and all three produce detectable sensor signatures 14 to 30 days before a production-impacting event occurs. AI-driven filling machine analytics continuously monitors valve actuation timing, fill weight variance across carousel positions, and drive motor current signatures to generate predictive work order triggers before performance degrades to a reject-producing threshold. Beverage plant engineers ready to apply predictive analytics to their filler assets can Book a Demo to see fill valve health monitoring configured for their specific equipment.
Carbonation System Analytics: Maintaining CO₂ Consistency and Pressure Stability
Carbonator PM Intelligence and Deaerator Performance Monitoring
Carbonation system performance directly determines product quality consistency — and yet carbonation equipment analytics remains one of the least-instrumented areas of most beverage plants. Inline carbonators, deaerators, and proportioning systems generate continuous process data that, when analyzed with machine learning, reveals dissolved oxygen creep, CO₂ dosing pump wear, and mixing ratio drift long before a batch fails carbonation specification. Carbonation system analytics platforms correlate product temperature at the carbonation stage, syrup-to-water ratio signals from proportioning units, and downstream fill pressure data to build a multivariate quality model that flags process deviations in real time — not after a failed QC sample. Plant engineers managing high-volume carbonated beverage lines can Book a Demo to see carbonation analytics configured against their process parameters.
Tunnel Pasteurizer Analytics: Temperature Uniformity and Energy Optimization
Pasteurizer Unit (PU) Compliance Monitoring and Spray Nozzle Health
Tunnel pasteurizers are simultaneously the highest energy-consuming asset and the most compliance-critical system in a packaged beverage operation. PU (pasteurization unit) delivery must be documented to meet food safety standards, while energy consumption per case must be minimized to protect margin. AI-driven tunnel pasteurizer analytics addresses both requirements simultaneously by monitoring zone temperature uniformity, conveyor speed stability, and spray nozzle flow distribution in real time. When zone temperature deviation or nozzle blockage is detected, the analytics platform generates both a maintenance alert and a real-time PU compliance recalculation — ensuring that corrective action is triggered before under-pasteurization occurs and before an audit finding becomes a recall risk.
| Pasteurizer Component | Key Analytics Signal | Failure Mode Detected | Detection Lead Time |
|---|---|---|---|
| Spray Nozzles | Flow rate per nozzle vs. zone baseline | Blockage / scale buildup | 7–14 days |
| Zone Temperature Control | Zone-to-zone delta deviation | Heat exchanger fouling | 10–21 days |
| Conveyor Drive | Speed consistency index | Chain stretch / bearing wear | 14–30 days |
| Recirculation Pumps | Flow rate vs. motor amp draw | Pump wear / cavitation | 10–20 days |
| PU Calculation Engine | Real-time PU delivery per zone | Under-pasteurization event | Real-time alert |
| Water Treatment System | pH, hardness, and TDS drift | Scale accelerating fouling | Daily trend flag |
CIP System Analytics for Beverage Plants: Optimizing Clean-in-Place Performance
CIP Beverage Plant Analytics — Reducing Chemical Waste and Ensuring Sanitization Compliance
CIP systems in beverage plants account for 25 to 40 percent of total water and chemical consumption — and in most facilities, CIP cycles run on fixed programs that were validated at commissioning and never analytically optimized. AI-driven CIP beverage plant analytics changes this by monitoring caustic concentration, rinse conductivity return curves, temperature profiles, and flow velocity per circuit to verify that cleaning efficacy targets are met with the minimum chemical and water input. When a CIP circuit underperforms — due to a worn pump, a partially closed valve, or a fouled line segment — the analytics platform flags the deviation before the next production run begins, preventing both microbiological risk and regulatory non-conformance. Beverage engineers managing complex multi-circuit CIP architectures can Book a Demo to see CIP analytics configured to their specific cleaning regime and compliance requirements.
Capping Machine and Labeler Analytics for Bottling Lines
Capping Machine PM and Labeler Analytics — Reducing Reject Rates and Changeover Losses
Capping machines and labelers are among the highest-frequency maintenance touchpoints on any bottling line, yet they are routinely underinstrumented compared to fillers and pasteurizers. Torque consistency monitoring on capping heads, chuck wear detection, and cap feed jam frequency tracking provide early warning of the defect patterns that drive consumer returns, retail delistings, and line stoppages. Labeler analytics — tracking label registration accuracy, glue temperature consistency, and web tension stability — prevent mislabeled product from reaching distribution while generating the maintenance signals needed to schedule gripper and drum replacements before a mid-run stoppage occurs. Plant engineers managing high-SKU bottling environments can Book a Demo to see capping and labeler analytics benchmarked against their current reject rate baseline.
AI-Driven Beverage Plant Analytics: OEE Tracking Across the Full Production Line
Bottling Line OEE Analytics — Root Cause Attribution Across Availability, Performance, and Quality Losses
Beverage production OEE measurement is widely practiced but rarely optimized, because most plants track a single blended OEE number rather than decomposing losses by root cause at the asset and shift level. AI-driven bottling line analytics changes this by automatically categorizing every speed loss, micro-stoppage, and quality reject event by equipment origin and failure mode — enabling maintenance and operations teams to prioritize the highest-impact interventions rather than responding to whichever alarm is loudest. Multi-SKU changeover complexity, seasonal carbonation parameter changes, and variable raw material quality all introduce OEE variability that rule-based systems cannot explain. Machine learning models trained on beverage-specific production patterns identify the non-obvious correlations — between ambient temperature and carbonation over-pressure stoppages, for example, or between specific cap lot numbers and capping head torque inconsistency — that drive chronic availability losses.
| OEE Loss Category | Common Root Cause | Analytics Detection Method | Typical Impact |
|---|---|---|---|
| Availability — Filler Stoppages | Fill valve seal failure, carousel bearing wear | Vibration + current signature anomaly | 3–8% OEE loss |
| Availability — Capper Jams | Chuck wear, cap feed obstruction | Torque drift trend + jam frequency counter | 1–4% OEE loss |
| Performance — Speed Loss | Conveyor tension inconsistency, backpressure | Speed deviation vs. nominal cycle time | 4–12% OEE loss |
| Quality — Fill Volume Rejects | Flow meter drift, valve actuation lag | Statistical process control multivariate model | 0.5–2.5% OEE loss |
| Quality — Carbonation Rejects | Deaerator DO creep, carbonator pressure instability | Inline CO₂ volume deviation alert | 1–3% OEE loss |
| Availability — CIP Overruns | Fouled circuits, pump degradation | CIP cycle duration vs. standard comparison | 2–6% OEE loss |
Implementation Roadmap: Deploying Beverage Production Equipment Analytics
A Phased Approach for Beverage Plant Engineers Adopting Predictive Maintenance
Successful AI-driven beverage plant analytics deployments follow a phased implementation model that generates value from existing data before requiring capital investment in expanded sensor infrastructure. The roadmap below reflects the deployment sequence that delivers the fastest time-to-value for beverage plant engineering teams working within constrained capital budgets and IT integration timelines.
Frequently Asked Questions: Beverage Production Equipment Analytics
What is beverage production equipment analytics and how does it differ from standard CMMS?
Beverage production equipment analytics applies machine learning to real-time sensor data from fillers, carbonators, pasteurizers, and packaging equipment to predict failures and quality deviations before they occur. Standard CMMS systems record maintenance history and manage work orders reactively — analytics platforms generate predictive maintenance triggers from asset health signals, enabling intervention before a failure event impacts production.
Which beverage plant assets benefit most from predictive maintenance analytics?
Rotary fillers, tunnel pasteurizers, and carbonation systems deliver the highest ROI from predictive analytics because their failure modes are detectable through sensor data 14 to 30 days ahead of a production impact event. Capping machines, CIP systems, and deaerators follow as secondary priority assets — high maintenance frequency with clearly detectable degradation signatures that justify sensor investment.
How does AI-driven CIP analytics reduce chemical and water consumption in beverage plants?
By correlating actual soil load measurements — turbidity, conductivity, and flow rate data — against chemical dosing and temperature parameters in real time, AI-driven CIP analytics identifies circuits where cleaning efficacy targets are met with less chemical than the fixed program uses. Beverage plants typically achieve 18 to 32 percent chemical cost reduction and 20 to 40 percent water consumption reduction within the first year of CIP analytics deployment.
Can beverage production analytics integrate with existing historian and SCADA systems?
Yes. Purpose-built beverage manufacturing analytics platforms support direct integration with OSIsoft PI, Ignition, Wonderware, and GE Proficy historian systems. Integration with SCADA and PLC data sources enables real-time analytics without requiring changes to validated control system configurations — a critical requirement for beverage operations with GMP documentation obligations.
What ROI should beverage plant engineers expect from an AI-driven analytics deployment?
Documented outcomes across beverage manufacturing deployments show 22 to 35 percent reduction in unplanned downtime, 15 to 29 percent improvement in bottling line OEE, and 18 to 32 percent reduction in CIP chemical and water costs. Most facilities achieve full platform payback within 8 to 14 months — with filler uptime improvement and pasteurizer energy optimization as the two largest ROI contributors.
How are tunnel pasteurizer PU compliance records managed with analytics platforms?
AI-driven pasteurizer analytics automatically calculate and log pasteurization unit delivery per production run by combining real-time zone temperature data, conveyor speed signals, and product-specific PU requirement parameters. Compliance records are generated automatically during production — eliminating manual data compilation and providing an audit-ready documentation trail that satisfies SQF, BRC, and FSMA regulatory requirements.