Packaging line analytics in food manufacturing has moved from a nice-to-have capability to a critical operational lever. For packaging engineers managing form-fill-seal machines, case packers, labelers, shrink wrappers, and palletizers, unplanned downtime and slow changeovers are margin destroyers hiding in plain sight. Modern AI-driven packaging line analytics transforms raw equipment data into precise, actionable intelligence — enabling engineers to reduce changeover time, predict failures before they occur, and schedule preventive maintenance at exactly the right intervals. Book a demo to see how iFactory's packaging analytics platform delivers measurable results from day one.
PACKAGING LINE ANALYTICS · CHANGEOVER OPTIMIZATION · PREDICTIVE MAINTENANCE
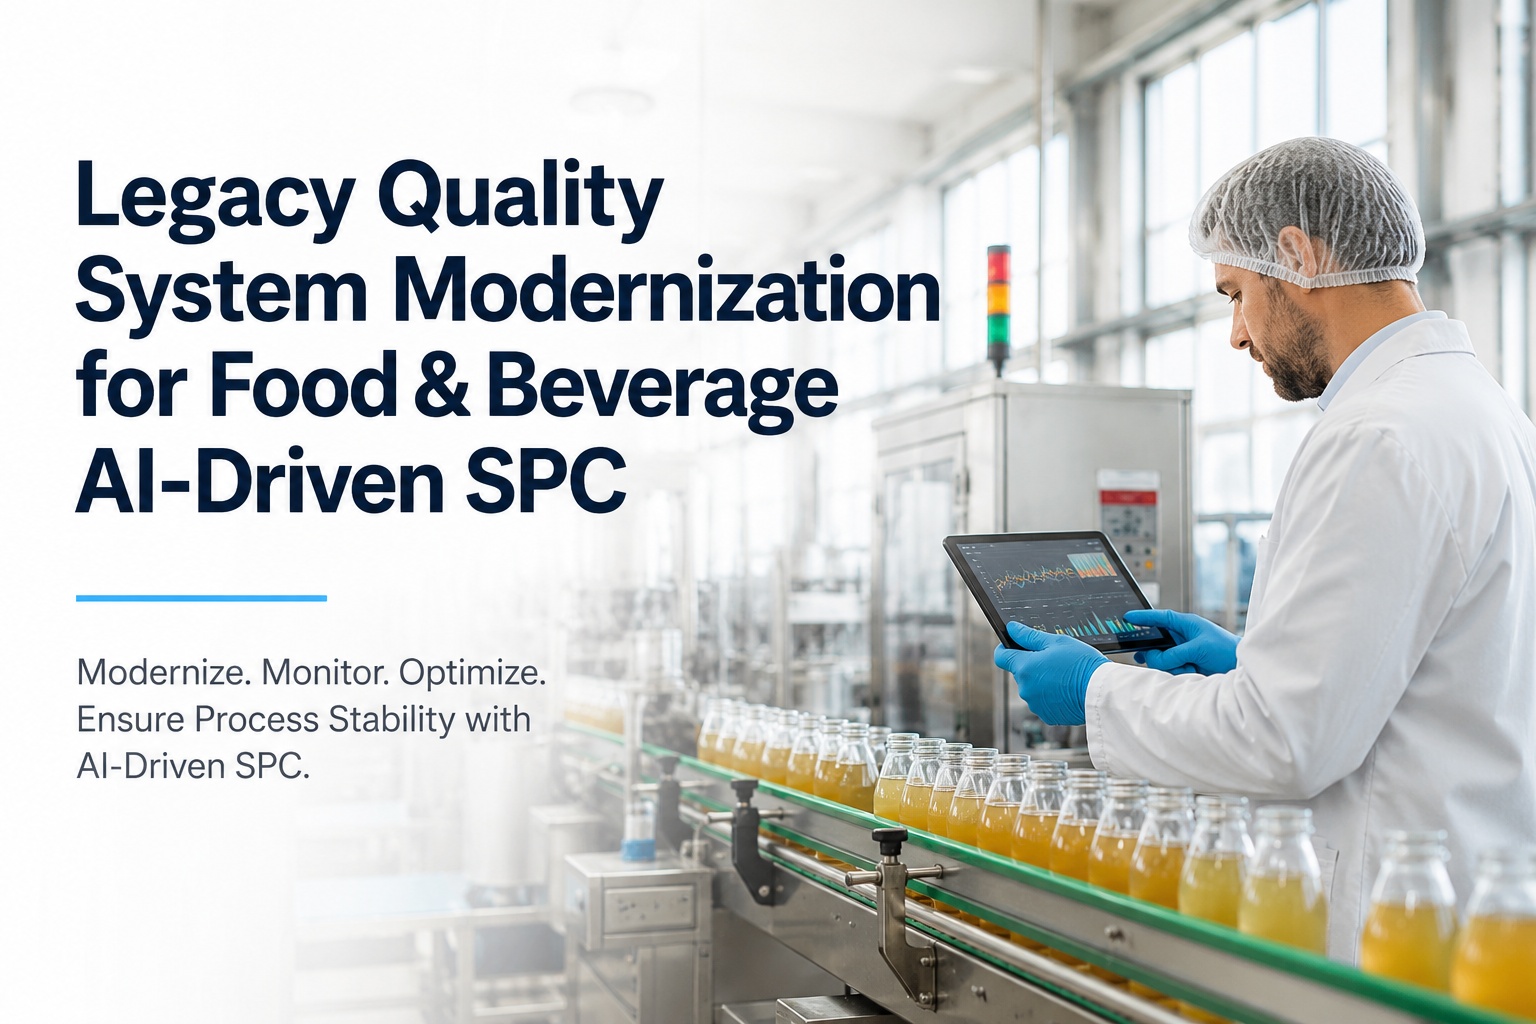
Reduce Packaging Line Changeover Time and Failures with AI-Driven Analytics
iFactory's packaging line analytics platform delivers real-time OEE visibility, SMED-based changeover optimization, and predictive PM scheduling across every machine in your food packaging operation.
Why Packaging Line Analytics Is a Priority for Food Manufacturers in 2026
Food packaging lines operate under relentless pressure. SKU proliferation has driven changeover frequency to record levels, while consumer demand for traceability and consistency raises the cost of every quality failure. For packaging engineers, the inability to access reliable, real-time equipment performance data means troubleshooting happens reactively — after yield is already lost, after a line has stopped, after the compliance record is already incomplete.
Packaging line analytics closes this gap by capturing machine-level data continuously, processing it against performance baselines, and surfacing the specific signals that precede failures and slowdowns. When integrated across form-fill-seal units, case packers, labelers, shrink wrappers, and palletizers, a unified analytics layer gives packaging engineers the network-wide visibility they need to manage throughput proactively rather than reactively. Engineers looking to benchmark their current gaps can book a demo with iFactory to run a full diagnostic against industry performance norms.
34%
Average reduction in unplanned packaging line downtime after analytics deployment
28%
Average changeover time reduction with SMED-based packaging analytics
91%
PM schedule compliance rate with automated predictive maintenance triggers
3.2x
Faster quality deviation detection with real-time packaging line monitoring
Changeover Optimization
Reducing Changeover Time on Food Packaging Lines with SMED Analytics
Changeover time is one of the most recoverable sources of lost capacity in food packaging operations. Yet most facilities still manage changeovers using paper checklists and verbal handoffs — practices that guarantee inconsistency and prevent meaningful improvement over time. Packaging line analytics provides the foundation for a genuine SMED (Single-Minute Exchange of Die) implementation by capturing exactly what happens during every changeover: which steps took longest, which sequences were performed out of order, and which machine states were not verified before restart.
For form-fill-seal machines, analytics-driven changeover management tracks film roll changeover time, seal parameter verification, and first-pack quality confirmation as distinct measurable events. For case packers and labelers, analytics captures format change sequences and identifies which operator teams consistently complete changeovers fastest — making their practice the documented standard for the rest of the facility. Packaging engineers ready to build a data-driven SMED program can book a demo with iFactory to see the changeover analytics module in action.
Changeover Time Benchmarks — Packaging Line Analytics Impact
Failure Prevention
Predictive Failure Detection Across Form-Fill-Seal, Case Packers, and Palletizers
Unplanned packaging line stoppages in food manufacturing are rarely sudden — they are the outcome of degradation patterns that were measurable days or weeks before the failure event. Packaging machine analytics detects these patterns by monitoring vibration signatures, motor current draw, temperature differentials, cycle time drift, and seal integrity metrics continuously, then comparing observed values against validated baseline ranges for each machine.
For form-fill-seal analytics, early warning signals typically include increasing seal jaw temperature variance, declining film tension consistency, and servo motor current anomalies. For palletizer PM in food facilities, analytics tracks gripper pressure decay, layer formation cycle time drift, and conveyor tension metrics that precede mechanical failure. Case packer analytics identifies erection inconsistency rates and compression force variance as leading indicators of jam events. When these signals are monitored continuously and cross-referenced with maintenance history, packaging engineers can intervene before failure — converting unplanned stops into scheduled PM events. Packaging engineers can book a demo to see how iFactory's predictive models are calibrated for food packaging equipment specifically.
01
Form-Fill-Seal Analytics: Seal Integrity and Film Tension Monitoring
FFS machines generate continuous data on seal jaw temperature, dwell time consistency, and film tracking variance. Analytics establishes control limits for each parameter and flags drift before it produces seal failures, product contamination events, or line stoppages. Seal integrity monitoring alone can prevent the most costly failure mode in flexible packaging operations.
02
Case Packer PM Scheduling with Predictive Analytics
Case packer analytics tracks erection failure rates, glue application consistency, compression force patterns, and conveyor timing across every shift. Predictive models identify when adhesive system performance begins degrading and when mechanical components are approaching wear thresholds — enabling PM scheduling that eliminates emergency maintenance events.
03
Labeler Analytics: Print Quality and Application Consistency
Labeler analytics in food manufacturing monitors print head temperature, label placement accuracy, and application roller pressure to detect the early-stage degradation that produces misapplied or illegible labels. For regulated food products, labeling failures carry compliance consequences — making continuous labeler monitoring a risk management requirement, not just an OEE concern.
04
Shrink Wrapper Analytics: Tunnel Temperature and Film Consumption
Shrink wrapper analytics monitors tunnel temperature uniformity, film consumption rate, and seal bar pressure to detect conditions that produce under-shrunk or burst packages before they reach downstream inspection. Film consumption analytics also identifies inefficiencies in wrapping cycle parameters that increase material cost without improving pack quality.
05
Palletizer PM in Food Manufacturing: Cycle Time and Gripper Monitoring
Palletizer analytics captures gripper pressure consistency, layer formation cycle time, and conveyor tension metrics across every pallet build cycle. Cycle time drift analysis identifies when mechanical systems are approaching failure thresholds, enabling PM scheduling that prevents the costly downstream disruption of an unplanned palletizer stoppage at end-of-line.
PM Scheduling
Transforming Food Packaging Equipment PM from Calendar-Based to Condition-Based
Calendar-based preventive maintenance schedules were designed for an era when equipment condition data was unavailable. In food packaging operations where machines run at different utilization rates, process different materials, and operate in varying environmental conditions across shifts, fixed-interval PM schedules are structurally unable to optimize maintenance timing. They generate unnecessary maintenance events on lightly loaded equipment and miss genuine failure windows on heavily utilized machines.
Packaging line analytics enables the transition from calendar-based to condition-based PM scheduling by monitoring the specific physical parameters that indicate actual equipment wear — not assumed wear based on elapsed time. When vibration signatures on a case packer's drive motor begin trending toward fault thresholds, analytics triggers a PM work order at the right time regardless of the calendar. When a form-fill-seal machine's seal jaw heater shows increasing temperature recovery time, analytics initiates a heater element inspection before a seal failure produces a product hold. Packaging engineers managing multi-machine lines can book a demo with iFactory to see condition-based PM scheduling across an entire packaging line simultaneously.
Eliminate Over-Maintenance on Low-Utilization Equipment
Condition-based scheduling prevents unnecessary PM on packaging machines operating below design utilization — reducing maintenance labor costs and eliminating the risk of maintenance-induced failure from unnecessary disassembly and reassembly.
Prevent Under-Maintenance on High-Demand Lines
Calendar-based PM consistently misses failure windows on heavily utilized packaging lines. Condition monitoring identifies when actual equipment wear is advancing faster than the schedule assumes — closing the gap before it becomes an unplanned stoppage.
Align PM Windows with Production Schedules
Predictive maintenance analytics provides advance notice of upcoming PM requirements, enabling maintenance scheduling coordinators to align work orders with planned changeover windows or low-demand production periods rather than executing emergency maintenance during peak runs.
Build Machine-Specific Failure History Databases
Every packaging machine develops a unique failure pattern profile over time. Analytics platforms accumulate machine-specific failure histories that progressively improve prediction accuracy, creating institutional knowledge that survives personnel turnover and informs future equipment procurement decisions.
OEE and Downtime Reduction
Packaging Downtime Reduction: How OEE Analytics Identifies the Real Loss Drivers
Overall Equipment Effectiveness (OEE) on packaging lines is rarely limited by a single cause. Packaging downtime reduction requires understanding the specific interaction of availability losses (unplanned stops), performance losses (speed reduction), and quality losses (rework and rejects) across each machine in the line — and identifying which losses are most recoverable with targeted intervention.
Packaging line OEE analytics disaggregates these losses to the machine level, shift level, and product-SKU level simultaneously. This granularity reveals patterns invisible to aggregate reporting: a labeler that performs well on primary SKUs but generates excessive rejects on promotional labels, a case packer that loses 12 minutes per shift to micro-stoppages that operators clear without logging, a palletizer that runs 8% below rated speed during night shifts due to a conveyor tension issue that was never formally reported. Identifying and eliminating these hidden losses is where packaging downtime reduction delivers its fastest ROI — and it requires the machine-level resolution that only continuous analytics can provide.
1
Establish Machine-Level OEE Baselines Across Every Packaging Asset
Deploy continuous data capture across form-fill-seal, case packer, labeler, shrink wrapper, and palletizer assets. Establish validated OEE baselines segmented by SKU, shift, and line configuration. These baselines become the reference point for all subsequent improvement initiatives and ROI measurement.
Outcome: Quantified OEE baseline with loss category breakdown per machine
2
Identify Top Loss Contributors with Pareto Analysis
Apply Pareto analysis to availability, performance, and quality losses across the packaging line to identify the 20% of loss causes producing 80% of OEE impact. Prioritize improvement initiatives based on recoverable yield rather than frequency of occurrence.
Outcome: Prioritized loss elimination roadmap ranked by OEE recovery potential
3
Deploy Targeted Interventions: SMED, Predictive PM, and Speed Optimization
Execute targeted improvement initiatives against the highest-impact loss categories: SMED programs for changeover losses, condition-based PM scheduling for availability losses, and speed optimization analytics for performance losses. Track OEE impact of each initiative independently to validate ROI.
Outcome: Measurable OEE improvement with attribution to specific interventions
4
Institutionalize Gains Through Digital SOP Updates and Operator Feedback Loops
Capture improvement practices in digital SOPs distributed to operator teams across all shifts. Establish real-time operator feedback loops that surface emerging issues before they become loss events — ensuring OEE gains are sustained rather than reversed when operating conditions change.
Outcome: Sustained OEE improvement with shift-level accountability and operator engagement
Packaging Analytics Case Study
A mid-size snack food manufacturer operating four packaging lines — including two FFS machines, a case packer, and an automated palletizer — deployed iFactory's packaging line analytics platform after years of managing maintenance reactively. Within the first 60 days, analytics identified a recurring seal jaw temperature drift pattern on the primary FFS machine that had been causing intermittent seal failures and product holds averaging 4.2 hours per week. Predictive PM scheduling eliminated the recurring failure event entirely. Across the four-line operation, unplanned downtime dropped 31% in the first production quarter — with changeover time on the case packer declining 26% after analytics-driven SMED implementation revealed three unnecessary process steps that had accumulated through informal practice changes over 18 months.
Book a demo to explore how iFactory's packaging analytics delivers similar results for your operation.
Frequently Asked Questions — Packaging Line Analytics in Food Manufacturing
What is packaging line analytics in food manufacturing?
Packaging line analytics is the continuous capture, processing, and analysis of machine-level performance data across packaging equipment — including form-fill-seal machines, case packers, labelers, shrink wrappers, and palletizers — to identify performance losses, predict failures, optimize changeovers, and schedule preventive maintenance based on actual equipment condition rather than calendar intervals.
How does packaging line analytics reduce changeover time?
Analytics platforms capture precise timestamps and machine state data for every step in the changeover sequence, enabling engineers to identify which steps consume the most time, which sequences are performed inconsistently across shifts, and where parallel activities can be introduced. This data foundation drives SMED implementation with measured outcomes rather than estimated improvement.
Which packaging machines benefit most from predictive analytics?
Form-fill-seal machines, case packers, and palletizers typically deliver the highest ROI from predictive analytics in food packaging operations due to the complexity of their failure modes, the cost of unplanned stoppages, and the volume of sensor data they generate. Labelers and shrink wrappers deliver significant additional value, particularly where product compliance and packaging integrity are regulatory requirements.
How long does it take to implement packaging line analytics?
Initial data capture and baseline OEE analytics can be activated within two to three weeks for most food packaging operations. Full predictive maintenance model deployment — with machine-specific failure pattern calibration — typically completes within 45 to 60 days, with ROI measurement achievable within the first production quarter after deployment.
Can packaging line analytics integrate with existing MES and CMMS systems?
Yes. Modern packaging analytics platforms integrate with existing manufacturing execution systems and computerized maintenance management systems via API connections, creating a unified data environment without requiring system replacement. Analytics enriches MES production records with machine-level performance data and feeds PM work orders directly into CMMS platforms automatically.
What is SMED and how does it apply to food packaging changeovers?
SMED (Single-Minute Exchange of Die) is a methodology for reducing changeover time by converting internal changeover activities (performed while the machine is stopped) to external activities (performed while the machine is still running). In food packaging, analytics platforms identify which changeover steps are genuinely internal versus which are internal only by convention — enabling teams to restructure changeover sequences and achieve substantial time reductions without capital investment.
AI-DRIVEN PACKAGING ANALYTICS · PREDICTIVE PM · CHANGEOVER OPTIMIZATION
Stop Losing Yield to Avoidable Packaging Line Failures and Slow Changeovers
iFactory's packaging line analytics platform delivers real-time OEE visibility, predictive maintenance scheduling, and SMED-based changeover optimization — purpose-built for food packaging engineers managing form-fill-seal, case packer, labeler, shrink wrapper, and palletizer assets.