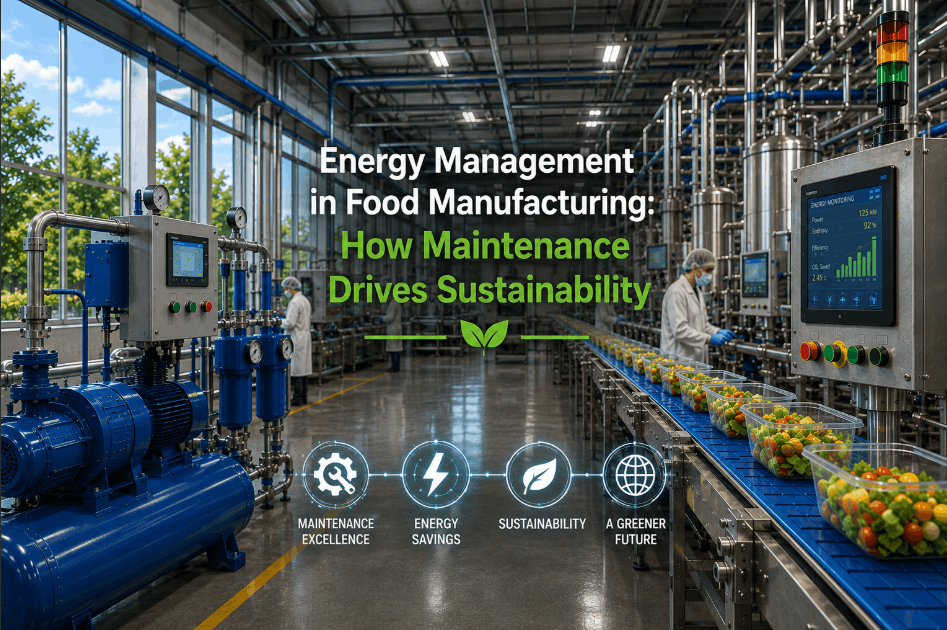
Food manufacturing plants are among the most energy-intensive industrial facilities in the world — yet most operators have no real-time visibility into where that energy is actually going. Compressors cycling inefficiently at 2 AM, HVAC systems fighting each other across production zones, refrigeration units running at suboptimal setpoints — these are not rare anomalies. They are the daily reality of plants that lack industrial energy analytics capable of surfacing what manual monitoring simply cannot detect. In 2026, the gap between plants that deploy energy management software and those still relying on monthly utility bills is no longer a competitive nuance — it is a measurable cost liability that compounds quarter after quarter. Book a Demo to see how AI-powered energy analytics expose the hidden leaks driving your utility costs.
Stop Paying for Energy You're Wasting
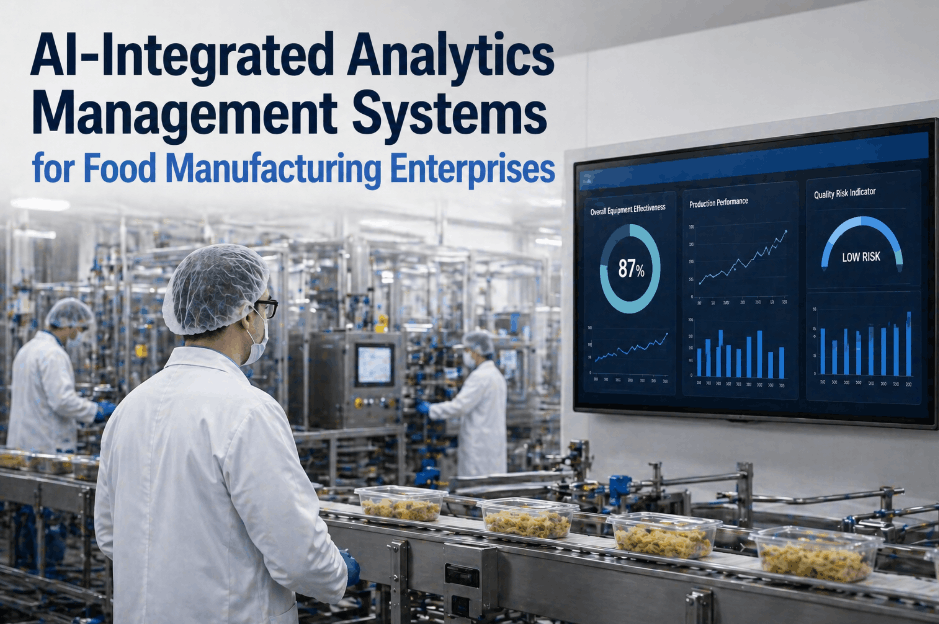
iFactory's industrial energy analytics platform connects directly to your plant assets, detects inefficiency in real time, and delivers actionable insights that reduce utility costs from day one.
Why Energy Inefficiency in Food Plants Is a Silent Profit Killer
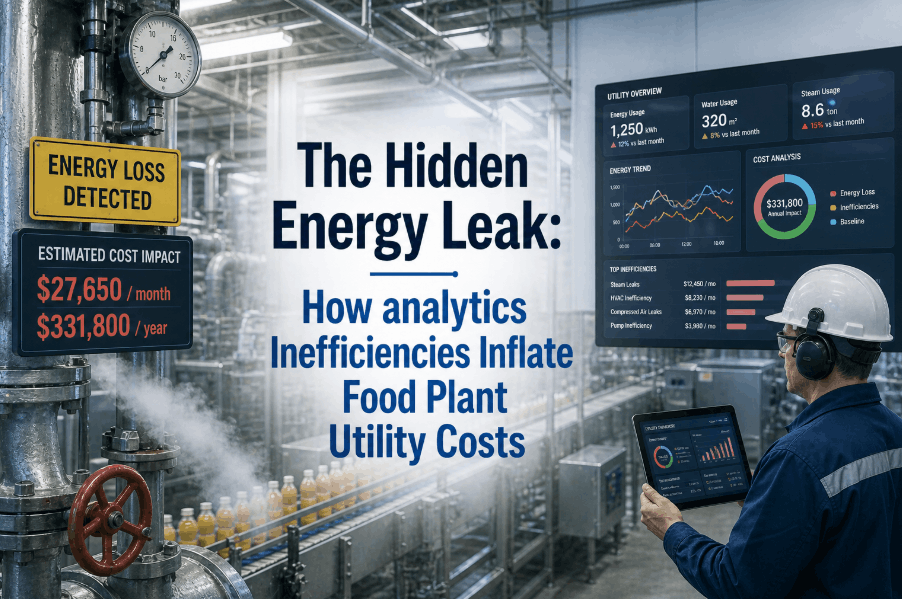
Most food plant operators are aware that energy is a significant operating cost. Few understand precisely how much of that cost is waste. Studies across the food and beverage manufacturing sector consistently show that 20–30% of total energy consumption in a typical facility is attributable to inefficiency rather than productive output — inefficiency that remains invisible without energy consumption analytics integrated at the asset level. The problem compounds because energy waste does not announce itself. A refrigeration compressor running 12% below peak efficiency does not trigger an alarm. A compressed air leak consuming 8% of your compressor's output does not show up on a production report. These losses accumulate silently across thousands of operating hours, and they surface only when the monthly utility invoice arrives — too late to trace, too diffuse to correct without systematic industrial IoT energy monitoring.
The financial stakes are significant. A mid-sized food manufacturing facility consuming 15 million kWh annually at an average blended rate of $0.09/kWh carries an annual energy cost of approximately $1.35 million. A conservative 15% efficiency improvement — well within reach with modern energy management software — represents over $200,000 in annual cost recovery. Across a multi-facility operation, that figure scales dramatically. Book a Demo and let us model the savings opportunity specific to your facility's energy profile.
The Five Most Common Energy Leaks Analytics Platforms Detect First
When manufacturing energy optimization platforms are deployed in food facilities for the first time, they consistently surface the same categories of waste. Understanding these patterns helps compliance and operations leaders prioritize where analytics-driven intervention delivers the fastest payback.
Compressed Air System Inefficiency
Compressed air is frequently the single largest energy cost in food manufacturing after refrigeration, yet it is also the least monitored. Leaks in distribution networks, pressure mismatches between production zones, and compressors cycling unnecessarily during low-demand periods are endemic. Compressor efficiency monitoring via real-time flow and pressure sensors paired with analytics software can identify and quantify leaks that manual walkdown inspections routinely miss — particularly in hard-to-access pipe runs and overhead distribution headers.
Refrigeration System Setpoint Drift and Load Imbalance
Refrigeration systems in cold storage and processing environments are engineered for specific setpoints and load profiles. Over time, setpoint drift — often introduced through well-intentioned manual adjustments — creates chronic overcooling or hunting conditions that drive compressor runtimes and electricity demand charges far above optimal levels. Asset performance management analytics that continuously compare actual refrigeration system performance against engineered baselines can detect setpoint drift within hours rather than the billing-cycle lag of utility invoice analysis.
HVAC Systems Running Against Each Other
In large food processing facilities with multiple HVAC zones, simultaneous heating and cooling of adjacent areas — a condition known as HVAC conflict or simultaneous heat-cool — is one of the most wasteful and least intuitive energy losses. Analytics platforms that correlate zone-level temperature data with damper positions, valve states, and AHU operation can identify these conflicts automatically and recommend schedule or control adjustments that eliminate the waste without affecting food safety or worker comfort requirements.
Off-Hours Baseload Creep
Non-production hours represent one of the most actionable energy reduction opportunities in food manufacturing — and one of the most overlooked. Energy monitoring systems that profile plant-level consumption by hour of day consistently reveal that off-hours baseload — energy consumed when production lines are idle — is 30–50% higher than engineered design intent in facilities without active off-hours energy management protocols. Lighting, exhaust fans, ancillary conveyor systems, and heating circuits running unnecessarily through night shifts account for the majority of this avoidable cost.
Demand Charge Spikes from Uncoordinated Equipment Startups
For facilities billed under demand-charge tariff structures — which applies to the majority of industrial electricity customers in the U.S. — the peak demand recorded in any 15-minute interval during a billing period determines the demand charge for the entire month. Uncoordinated equipment startups at shift change, when multiple high-draw assets start simultaneously, routinely create demand spikes that inflate utility costs far beyond what actual consumption would justify. Utility cost optimization software that monitors and predicts demand peaks in real time enables start-sequence staggering that systematically reduces peak demand without disrupting production schedules.
How Industrial Energy Analytics Platforms Work: A Technical Overview
Modern energy management software for food manufacturing operates across three interconnected layers: data acquisition, analytical processing, and decision support. Understanding how these layers interact helps operations and engineering leaders evaluate platform capabilities against their specific facility architecture and data infrastructure.
| Platform Layer | Data Sources | Analytical Function | Operational Output |
|---|---|---|---|
| Data Acquisition | Smart meters, PLCs, IoT sensors, BMS feeds, SCADA | Real-time ingestion and normalization at 1–15 min intervals | Unified energy data stream across all assets |
| Analytical Engine | Historical consumption, production schedules, weather data | Anomaly detection, baseline modeling, efficiency scoring | Flagged inefficiencies with cost impact quantification |
| Predictive Layer | Asset operating history, maintenance records, sensor trends | Degradation forecasting, failure probability modeling | Maintenance recommendations before efficiency loss accelerates |
| Decision Support | Utility tariff structures, production plans, carbon targets | Optimization scenario modeling, ROI calculation | Prioritized action list with financial justification |
| Reporting and Compliance | All platform data plus external benchmarks | KPI tracking, trend analysis, sustainability metrics | Audit-ready carbon footprint and energy performance reports |
The distinction between basic energy monitoring systems and truly analytical platforms lies in the third and fourth layers. Monitoring tells you what happened. Analytics tells you what it means, what caused it, and what to do about it — with the financial context needed to prioritize action. Book a Demo to see how iFactory's analytical engine surfaces actionable efficiency findings within the first week of deployment.
Predictive Maintenance: The Energy Efficiency Multiplier
Predictive maintenance software and energy analytics are not separate disciplines — they are two outputs of the same underlying asset performance data. Equipment degradation and energy inefficiency are directly correlated: a refrigeration compressor with worn valve assemblies consumes more energy per ton of cooling output; a conveyor drive with failing bearings draws higher current under load; a heat exchanger with fouled surfaces requires more energy to achieve the same thermal transfer rate. Equipment performance monitoring platforms that integrate energy consumption data with vibration, temperature, and current signature analysis can detect the specific degradation signatures that predict both equipment failure and efficiency loss — enabling targeted maintenance interventions that recover energy performance before failure forces costly emergency repairs and unplanned downtime.
For food manufacturers managing tight production schedules and thin maintenance budgets, this integration is transformative. Rather than choosing between reactive maintenance (cheap until it isn't) and blanket preventive maintenance (expensive and often unnecessary), asset performance management analytics enable condition-based maintenance that directs resources precisely where degradation is occurring and energy performance is deteriorating. The result is lower maintenance cost, fewer emergency breakdowns, and systematically better energy performance — simultaneously. Book a Demo to explore how predictive maintenance and energy analytics combine in a single platform built for food manufacturing environments.
Sustainability Analytics and Carbon Footprint Tracking: Meeting the New Regulatory and Customer Expectations
Energy efficiency in food manufacturing is no longer purely a cost management story. Regulatory pressure from the SEC's climate disclosure rules, customer sustainability scorecards from major retail and foodservice buyers, and voluntary ESG commitments made to investors have elevated carbon footprint tracking from a nice-to-have to a board-level reporting obligation for many food manufacturers. Sustainability analytics platforms that automatically convert energy consumption data into Scope 1 and Scope 2 greenhouse gas emissions — using current grid emission factors and verified conversion methodologies — eliminate the manual calculation burden that makes emissions reporting slow, error-prone, and difficult to audit.
Scope 2 Electricity Emissions Tracking
Market-based and location-based Scope 2 calculations require granular electricity consumption data by facility, meter, and time period. Analytics platforms that maintain this data automatically — with audit trails — dramatically simplify annual GHG inventory preparation and third-party verification processes.
Energy Intensity KPI Benchmarking
Production-normalized energy intensity metrics — kWh per unit produced, BTU per pound of output — are the foundation of meaningful performance benchmarking across product lines, shifts, and facilities. Analytics platforms that calculate these KPIs automatically from integrated production and energy data enable honest performance comparisons that manual reporting cannot sustain.
Renewable Energy Credit Management
Food manufacturers pursuing renewable energy procurement need consumption data at the resolution required for REQ matching and VPPA contract settlement. Energy analytics platforms with sub-hourly metering capabilities provide the data infrastructure these instruments require, turning sustainability commitments into verifiable, auditable records.
Customer Sustainability Scorecard Reporting
Major retail buyers increasingly require supplier sustainability performance data as part of vendor qualification and annual review processes. Analytics platforms that generate standardized sustainability reports — aligned with GHG Protocol, CDP, or customer-specific formats — replace ad-hoc spreadsheet preparation with exportable, audit-ready documentation.
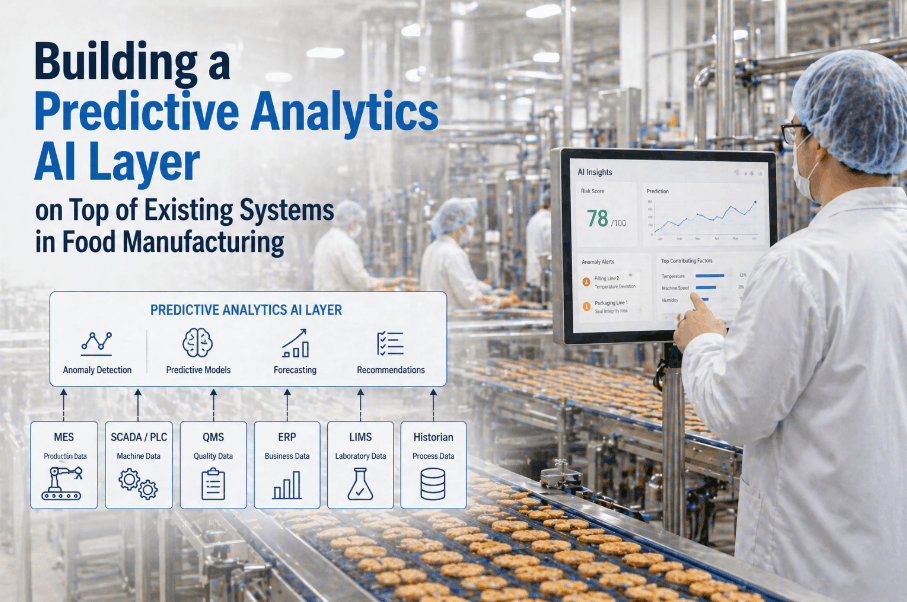
Smart Factory Energy Management: Integrating OT and IT for Facility-Wide Visibility
Smart factory energy management requires breaking down the traditional separation between operational technology (OT) — the SCADA systems, PLCs, and process controllers that run production — and information technology (IT) — the ERP, MES, and data infrastructure that manages business processes. Energy analytics platforms that integrate across both domains transform siloed asset-level data into facility-wide intelligence that neither OT nor IT systems can produce independently. When production schedules from the MES are correlated with asset-level energy consumption from SCADA, analytics platforms can calculate the true energy cost of each production run, product SKU, and shift — enabling cost accounting precision that changes how plant managers evaluate scheduling decisions, product mix, and capacity utilization.
The industrial IoT energy monitoring infrastructure required for this integration has become dramatically more accessible in the past three years. Wireless submetering devices, OPC-UA connectors for legacy PLC data, and cloud-native analytics platforms with pre-built integrations for common food manufacturing ERP and MES platforms mean that operational efficiency software deployments that previously required 12–18 months of custom integration work can now be completed in weeks. Book a Demo to review iFactory's integration architecture against your specific OT and IT environment.
Measuring ROI: What Food Manufacturers Actually Achieve with Energy Analytics
Quantifying the return on investment from energy management software deployment requires looking beyond simple energy cost reduction to the full spectrum of financial benefits these platforms generate across plant operations.
These figures reflect documented outcomes across food manufacturing deployments — not theoretical potential. The breadth of the ROI case is important: cost reduction from lower utility bills, cost avoidance from fewer equipment failures, revenue protection from reduced unplanned downtime, and compliance cost reduction from automated sustainability reporting each contribute independently to a financial case that rarely requires a long payback period to justify.
Frequently Asked Questions: Energy Analytics for Food Manufacturing
What data infrastructure is required to deploy industrial energy analytics?
Most modern energy analytics platforms can connect to existing facility data sources including smart utility meters, BMS systems, PLCs via OPC-UA or Modbus, and SCADA historian exports. Facilities without existing submetering can deploy wireless IoT meters on key assets as part of the platform rollout, typically within two to four weeks.
How quickly do energy analytics platforms generate actionable findings?
Platforms with pre-built anomaly detection models can surface the first actionable efficiency findings within days of data ingestion — before full baseline models are established. Compressed air leaks, HVAC conflicts, and off-hours baseload anomalies are typically identified within the first week of connected monitoring.
Can energy analytics support multi-facility food manufacturing operations?
Yes. Cloud-native energy analytics platforms are designed for multi-site deployment, enabling corporate energy managers to compare facility performance, normalize consumption by production output, and identify the highest-opportunity facilities for targeted efficiency intervention — all from a single dashboard.
How does energy analytics integrate with existing maintenance management systems?
Leading platforms offer API integrations with common CMMS platforms including SAP PM, IBM Maximo, and Infor EAM. When an energy analytics platform detects a degradation signature on a specific asset, it can automatically generate a work order in the CMMS with asset ID, fault description, and energy impact quantification — closing the loop between analytics and corrective action.
What is the difference between energy monitoring and energy analytics?
Energy monitoring records consumption data and presents it as dashboards and reports. Energy analytics applies statistical models, machine learning, and contextual data — production schedules, weather, asset operating history — to detect anomalies, identify root causes, forecast performance, and prioritize corrective actions. Monitoring describes what happened; analytics explains why and recommends what to do.
Ready to Recover the Energy Costs Hidden in Your Plant Operations?
iFactory's smart factory energy management platform delivers real-time visibility, AI-driven anomaly detection, and integrated predictive maintenance — purpose-built for food and beverage manufacturing environments. Start recovering measurable utility cost savings within weeks of deployment.