Government analytics benchmarking is transforming how municipalities measure success, justify budget allocations, and improve service delivery for their citizens. As public sector leaders face increasing pressure to demonstrate fiscal responsibility and operational transparency, municipal benchmarking platforms are emerging as the essential tool for comparing performance across peer cities. By standardizing metrics like cost per capita, emergency response times, and Facility Condition Index (FCI) scores, agencies can move beyond anecdotal evidence to genuine data-driven municipal management. This article explores the frameworks, metrics, and technologies driving the future of government performance comparison.
MUNICIPAL PERFORMANCE · AI-DRIVEN BENCHMARKING · DATA TRANSPARENCY
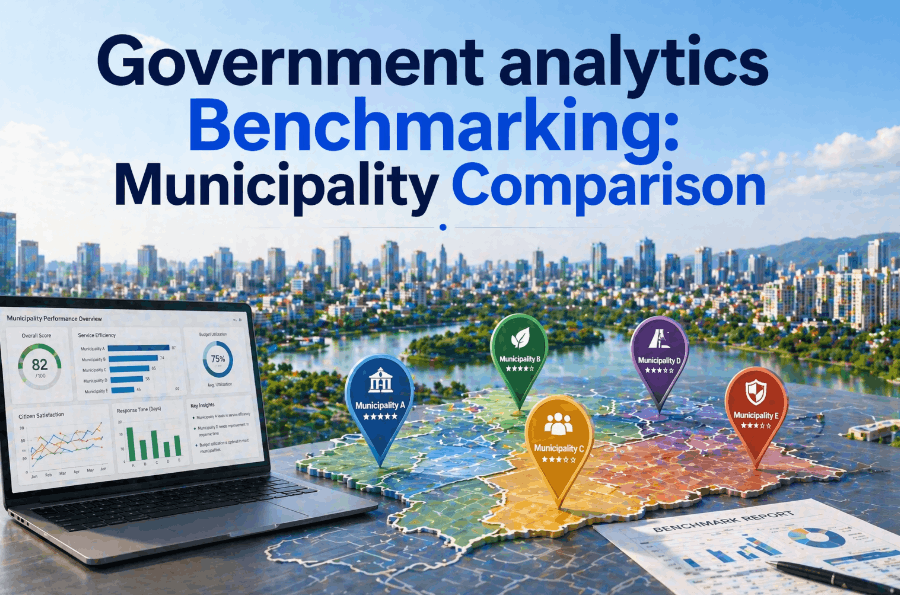
Benchmark Your Municipality Against High-Performing Peers With AI Analytics
iFactory's government benchmarking platform delivers standardized KPI comparisons, peer-grouping analytics, and predictive performance modeling — enabling municipalities to identify efficiency gaps, optimize infrastructure spend, and achieve world-class service levels through shared data intelligence.
Why Data-Driven Benchmarking Is Essential for Modern Municipal Governance
For decades, municipal performance was measured in isolation. A city might know its own pothole repair time or park maintenance cost, but without a comparative context, it had no way of knowing if those figures represented operational excellence or systemic inefficiency. Government analytics benchmarking solves this by creating a unified language of performance. By comparing data against similar municipalities—grouped by population, budget size, and climate—leaders can finally answer the critical question: "Are we delivering the best possible value for our taxpayers?"
The shift toward comparative municipal analytics is being driven by the need for objective budget justification and the rise of smart city infrastructure. When a public works department can prove that their asset sustainability ratio is 15% lower than the regional average, it creates a powerful, data-backed case for infrastructure investment. Furthermore, as AI-driven platforms begin to aggregate data from hundreds of municipalities, the ability to predict service failures and optimize resource allocation across jurisdictions becomes a reality, moving municipal management from reactive to proactive. Book a demo to assess your baseline maturity.
22%
average reduction in operational cost per capita through data-driven benchmarking
15%
improvement in Facility Condition Index (FCI) scores over 24 months of peer comparison
35%
faster emergency response times achieved by benchmarking against top-quartile peers
$1.2M
average annual efficiency gain for mid-sized municipalities using comparative KPI grids
Key Comparison Domains
Core Pillars of Municipality Comparison and Performance Benchmarking
Effective municipality comparison requires a multi-dimensional approach. While financial metrics are foundational, they must be balanced against service quality, asset health, and sustainability indicators to provide a complete picture of municipal performance.
Infrastructure and Asset Management Benchmarking
Compare your Facility Condition Index (FCI) and Bridge Sufficiency Ratings against regional and national benchmarks. This allows public works directors to identify if their deferred maintenance backlog is growing faster than their peers, enabling more strategic long-term capital planning. By understanding the replacement value and current condition of assets in a comparative context, municipalities can move away from "squeaky wheel" maintenance to data-driven prioritization that maximizes the lifespan of critical infrastructure.
Public Safety and Emergency Response Analytics
Benchmark response times for fire, EMS, and police services against NFPA standards and peer-group averages. Detailed public safety benchmarking goes beyond raw times to analyze incident density per 1,000 residents, resource deployment efficiency, and outcomes-based metrics. This data is critical for justifying new station locations or equipment upgrades, ensuring that emergency services are optimized to meet the specific demographic and geographic challenges of the municipality compared to its peers.
Sustainability and Environmental Impact Comparison
As climate mandates increase, government sustainability benchmarking enables cities to compare carbon footprints per capita, energy intensity of municipal buildings, and waste diversion rates. This peer-to-peer data helps municipalities identify successful green initiatives in similar jurisdictions and adapt them locally. Tracking energy spend per square foot across municipal facilities against top-performing "green cities" provides clear targets for HVAC upgrades, lighting retrofits, and renewable energy integration.
Administrative Efficiency and Cost per Capita
Analyze the true cost of administrative functions—procurement, HR, and IT—relative to population and budget size. Administrative benchmarking identifies bloated processes by comparing cycle times for permit approvals, hiring, and vendor payments. Municipalities that benchmark their cost-to-serve metrics often find opportunities to consolidate legacy systems or automate manual workflows that their peers have already modernized, leading to significant overhead reductions without impacting citizen-facing services.
Citizen Service Satisfaction and Digital Engagement
Compare digital service adoption rates, 311 resolution times, and citizen satisfaction scores against high-performing digital municipalities. Service delivery benchmarking helps cities understand where their digital friction points exist compared to the best-in-class standard. By measuring the percentage of transactions completed online vs. in-person against peer benchmarks, IT leaders can prioritize UX improvements that drive the highest return on citizen engagement and operational efficiency.
Fiscal Health and Revenue Performance Benchmarking
Benchmark tax collection efficiency, debt-to-revenue ratios, and reserve fund levels against GASB recommendations and peer-group medians. Fiscal benchmarking provides early warning signals of financial stress by comparing revenue volatility and expenditure growth rates against historical peer trends. This comparative financial intelligence is vital for maintaining high credit ratings and ensuring that the municipality's long-term financial strategy is aligned with the most successful fiscal models in the public sector.
Impact Analysis
Quantifying the Value of Government Analytics Benchmarking Programs
The implementation of a formal municipal benchmarking program delivers measurable value across the entire organization. By moving from isolated data to comparative intelligence, municipalities can achieve a "race to the top" effect where underperforming departments are incentivized and equipped to match the results of their most efficient peers.
01
Standardization of Performance Metrics
The first impact of a benchmarking program is the establishment of a "single source of truth." By adopting standardized definitions for metrics like "cost per lane mile" or "average permit cycle time," the municipality eliminates internal data silos and ensures that every department is measuring success the same way. This clarity alone often identifies 5-10% in immediate efficiency gains by surfacing obvious operational outliers that were previously hidden by inconsistent reporting formats.
02
Identification of High-Impact Efficiency Gaps
With standardized data, the municipality can now conduct "gap analysis" against peer groups. If a city’s fleet maintenance cost per vehicle is 40% higher than the peer median, it points to a specific, high-value area for investigation — whether it's an aging fleet, inefficient parts procurement, or lack of predictive maintenance. Benchmarking focuses management attention on the 20% of problems causing 80% of the efficiency loss, maximizing the ROI of administrative improvement projects.
03
Evidence-Based Budgeting and Capital Planning
Comparative data transforms the budget process from a negotiation into a data-driven strategy session. Department heads can use peer benchmarks to justify equipment replacements, staffing increases, or technology investments. "Our response times are falling behind our peers by 12% because our fleet is 3 years older than the average" is a far more compelling argument to a city council than a generic request for new vehicles. This leads to more equitable and effective distribution of limited municipal resources.
04
Continuous Improvement and Public Transparency
The final stage of impact is the institutionalization of continuous improvement. By publishing benchmarking results in public dashboards, municipalities build trust with their residents through radical transparency. Citizens can see not just what the city is doing, but how it ranks against its neighbors. This accountability drives sustained performance improvements, as department leaders strive to show year-over-year progress against the regional and national benchmarks that matter most to the community.
Book a demo to explore our transparency frameworks.
KPI INTELLIGENCE · STANDARDIZED DATA · PERFORMANCE AUDIT
Eliminate Guesswork with Standardized KPI Benchmarking
Stop relying on inconsistent internal reports. iFactory's comparative analytics engine provides the standardized data and peer-group intelligence needed to justify every dollar of your municipal budget.
Municipal Performance Comparison — Internal Reporting vs. Benchmarking Analytics
How municipalities perform when relying on isolated internal reports versus integrated, peer-group benchmarking platforms.
Municipal Performance Strategy — Benchmarking vs. Isolated Reporting
Implementation Guide
Building a High-Impact Municipal Benchmarking Program — Best Practices
Launching a successful government benchmarking analytics program requires more than just software. It requires a cultural shift toward data transparency and a structured implementation process that ensures data quality and peer-group relevance from day one.
01
Select Peer Groups Based on Operational Realities, Not Just Proximity
Effective benchmarking relies on comparing "apples to apples." When selecting peer municipalities, look beyond geographic neighbors to cities with similar population densities, climate conditions (which impact infrastructure wear), median household income, and municipal charter types. A city of 50,000 in a desert climate has very different road maintenance and water usage profiles than a city of 50,000 in a coastal environment.
Book a demo to see how AI-driven platforms can automatically group your municipality with the most relevant peers globally to ensure your benchmarks are both fair and challenging.
02
Automate Data Ingestion to Ensure Real-Time Comparison
Benchmarking against year-old PDF reports provides zero operational value for today's challenges. High-impact programs utilize API connections to ingest data directly from ERP, CMMS, and GIS systems. This allows department heads to see their performance relative to peers in real-time, enabling them to make course corrections during the fiscal year rather than waiting for an end-of-year audit. Automation also removes the manual "data cleaning" burden from staff, ensuring that benchmarking is an aid to productivity, not an administrative tax.
03
Focus on Outcomes and Quality, Not Just Throughput
A municipality can have the lowest cost per pothole repair but the highest rate of repair failure. Mature benchmarking programs balance efficiency metrics (cost, speed) with quality and outcome metrics (longevity, citizen satisfaction). Tracking "Cost per Clean Lane Mile" is useful, but only when paired with "Citizen Satisfaction with Road Quality" and "Pavement Quality Index (PQI)" scores. This prevents "race to the bottom" behavior where quality is sacrificed to meet arbitrary efficiency benchmarks.
04
Foster a Culture of Learning, Not Just Comparison
The most successful municipalities view benchmarking as a way to identify "bright spots"—peer departments that are achieving extraordinary results. When the data shows a neighboring city has solved a common procurement bottleneck, it should trigger a collaborative inquiry into their process, technology, and staffing model. Benchmarking should be framed internally as a tool for professional development and operational excellence, rather than a punitive scorecard. This encourages staff at all levels to engage with the data and suggest improvements.
Regulatory Alignment
How Municipal Benchmarking Supports Government Compliance and Reporting Mandates
Government benchmarking is increasingly becoming a regulatory necessity rather than an optional best practice. Federal grants, state-level performance mandates, and bond rating agencies are all looking for the standardized performance data that a mature benchmarking platform provides.
GASB Performance Reporting Standards
- Alignment with GASB Concepts Statement No. 2 on service efforts
- Standardized reporting of municipal service outcomes and outputs
- Audit-ready documentation of performance data collection methods
- Year-over-year comparative analysis for financial statement notes
Financial Compliance: Fully Standardized
State Performance Transparency Mandates
- Automated data feeds to state-level municipal performance portals
- Compliance with "Open Data" laws and transparency requirements
- Verification of service levels for state-funded infrastructure grants
- Comparative dashboards for state-mandated efficiency audits
State Reporting: Real-Time Automated
Bond Rating and Credit Risk Analysis
- Comparative fiscal health metrics for Moody’s/S&P evaluations
- Documentation of asset sustainability and maintenance backlog
- Evidence of data-driven management for operational risk reduction
- Benchmarking of revenue volatility and debt-to-service ratios
Credit Readiness: Data-Backed Confidence
Municipality Outcome
A growing suburban municipality with 85,000 residents was facing a 12% annual increase in public works expenditures without a corresponding increase in service quality. By implementing iFactory's benchmarking platform, they discovered that their snow removal cost per lane mile was 38% higher than their peer-group median, while their pavement quality was 14% lower. Detailed peer-analysis revealed that high-performing cities were using predictive weather analytics and pre-wetting technologies that the municipality had not yet adopted. Within one winter season of implementing these data-driven peer practices, the city reduced salt usage by 24% and overtime costs by 31%, delivering a total operational saving of $420,000. These savings were reinvested into a high-priority bridge repair project that had been deferred for three years, improving the city's overall FCI score by 8 points in a single fiscal cycle.
Strategic Roadmap
The Path to Data-Driven Municipal Excellence — A 12-Month Benchmarking Roadmap
Transitioning from siloed reporting to a culture of comparative municipal benchmarking is a journey. This roadmap provides a phased approach to building a sustainable, high-impact benchmarking ecosystem that delivers measurable results at every stage of adoption.
1
Phase 1: Data Inventory and Peer Group Selection (Months 1–3)
Conduct a comprehensive audit of existing data sources across all municipal departments. Identify the "high-value" KPIs that are currently being tracked and select an initial peer group of 10–15 municipalities for comparison. Establish standardized definitions for these metrics to ensure that initial benchmarking results are credible and actionable. This phase focuses on building the foundation of trust in the data that will drive all future management decisions.
Outcome: Standardized KPI registry and validated peer-group architecture
2
Phase 2: Platform Integration and Baseline Benchmarking (Months 4–6)
Deploy the benchmarking platform and integrate it with core municipal systems (ERP, GIS, Asset Management). Generate the first full "State of the City" benchmarking report, identifying the top three efficiency gaps across the organization. Conduct deep-dive analysis into these gaps to determine root causes—whether they are technological, procedural, or resource-related. This phase moves the municipality from "guessing" to "knowing" where its biggest improvement opportunities lie.
Book a demo to view sample gap reports.
Outcome: Real-time benchmarking dashboard with identified high-impact efficiency gaps
3
Phase 3: Operational Optimization and Peer Learning (Months 7–9)
Launch targeted improvement projects in the high-impact areas identified in Phase 2. Engage with peer municipalities that are currently performing in the top quartile for those metrics to learn their best practices. Implement pilot technology or process changes based on this peer-intelligence and monitor performance shifts in real-time. This phase is where the "comparative advantage" of benchmarking translates into actual operational savings and service improvements.
Outcome: Measurable improvement in core KPIs and documented ROI from pilot projects
4
Phase 4: Transparency Activation and Continuous Improvement (Months 10–12)
Publicly launch the municipal performance portal, providing residents with transparent access to benchmarking results. Establish a permanent "Performance Excellence" committee that reviews benchmarking data monthly and sets year-over-year improvement targets for all departments. Integrate benchmarking results into the annual budget cycle as the primary justification for resource allocation. This phase completes the transformation to a data-driven, high-performing municipality.
Outcome: Fully institutionalized benchmarking culture with maximum public transparency
PROVEN FISCAL IMPACT · 22% COST REDUCTION · AUDIT-READY
Optimize Your Municipal Performance with Comparative Analytics — Book a Demo Today
iFactory's government analytics benchmarking platform provides the peer intelligence, standardized metrics, and real-time dashboards you need to transform your municipality into a high-performing, data-driven organization. See how your city compares to the best in the nation.
Frequently Asked Questions — Government Analytics Benchmarking and Municipality Comparison
What is government analytics benchmarking for municipalities?
Government analytics benchmarking is the systematic process of measuring and comparing a municipality's performance metrics—such as cost per capita, response times, and asset health—against a peer group of similar cities. This comparative data identifies operational inefficiencies, justifies budget requests, and provides a clear roadmap for continuous service improvement based on proven best practices from high-performing peers.
How are "peer groups" selected for municipality comparison?
Peer groups are selected using multi-dimensional criteria that go beyond simple geographic proximity. Key factors include population density, median household income, climate (which impacts infrastructure maintenance), budget size, and municipal structure (e.g., Council-Manager vs. Mayor-Council). Advanced AI benchmarking platforms automatically group municipalities with the most relevant operational peers to ensure that comparisons are fair, accurate, and actionable.
What is the Facility Condition Index (FCI) and why is it benchmarked?
The Facility Condition Index (FCI) is a standardized measure of a building’s condition, calculated as the ratio of deferred maintenance costs to the current replacement value. Benchmarking FCI allows municipalities to see if their infrastructure is aging faster or slower than their peers. A lower FCI score indicates better asset health. Benchmarking this metric is vital for long-term capital planning and justifying infrastructure maintenance budgets to city councils and taxpayers.
Can benchmarking help reduce a municipality's operational cost per capita?
Yes. By comparing cost-to-serve metrics across administrative and operational departments, municipalities can identify specific areas where their spending is significantly higher than the peer median. This often surfaces outdated processes, legacy technology costs, or inefficient resource allocation. Cities that use benchmarking to drive operational optimization typically achieve a 15–25% reduction in cost per capita within the first two years.
How does benchmarking support GASB and state-level reporting requirements?
Modern benchmarking platforms are designed to align with GASB Concepts Statement No. 2, which emphasizes reporting on service efforts and accomplishments. They provide the standardized data and year-over-year comparative analysis required for high-quality financial reporting and state-level transparency portals. This automated reporting layer ensures that municipalities are always audit-ready and compliant with emerging "Open Data" laws.
What is the ROI of implementing a government benchmarking platform?
The ROI of municipal benchmarking is typically realized through a combination of operational savings, improved asset lifespans, and faster budget approvals. Most municipalities recover the full platform investment within 6–12 months by identifying and closing just 2 or 3 significant efficiency gaps. Beyond direct savings, the long-term ROI includes higher credit ratings, successful grant applications, and increased citizen trust through data transparency.
The Standard for High-Performing Municipalities
iFactory — Government Benchmarking That Delivers Measurable Operational Excellence
Municipalities that operate in isolation are operating in the dark. iFactory's government analytics benchmarking platform provides the comparative intelligence, peer-group data, and predictive modeling that public sector leaders need to transform their cities into models of efficiency, transparency, and fiscal health — built on the foundations of shared municipal intelligence.
Standardized peer-grouping based on population, climate, and budget profiles
Real-time KPI comparison across all critical municipal and public works domains
Automated GASB-aligned performance reporting and public transparency dashboards
Predictive gap analysis identifying the highest-impact efficiency opportunities
Infrastructure asset health benchmarking using FCI and replacement value models
Integration-ready architecture connecting to existing municipal ERP and GIS systems