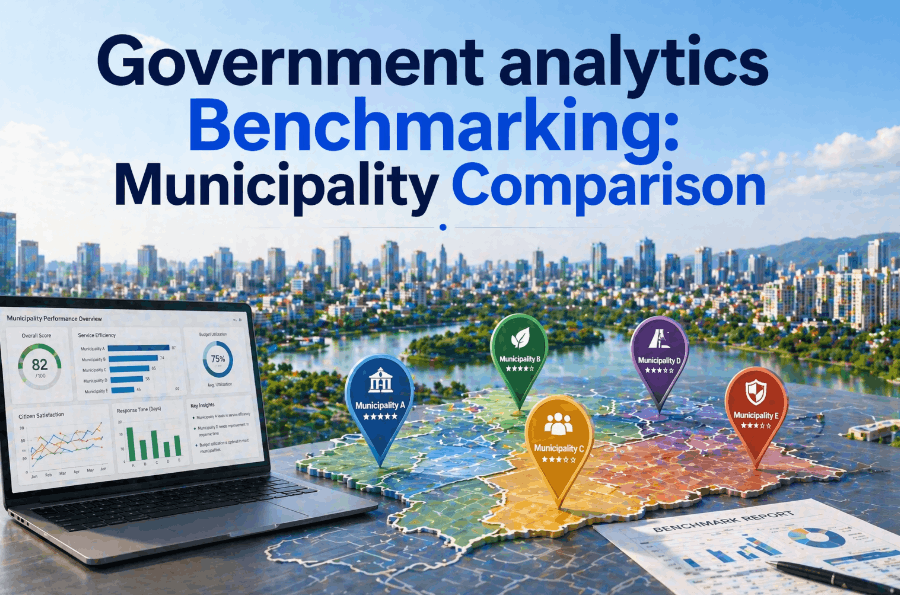
Government asset management has entered a new era of performance accountability. For public works departments across the US, UK, Canada, Germany, and UAE, tracking the right government asset management KPIs is no longer optional — it is the foundation of fiscal responsibility, citizen trust, and infrastructure longevity. Yet many municipal and federal agencies still rely on spreadsheets, delayed reports, and reactive workflows that mask the true cost of underperformance. This article identifies the top 10 KPIs every public works director and government finance officer should track — and explains how AI-powered platforms are turning raw data into actionable intelligence. Book a demo to see how iFactory tracks these KPIs for your agency.
Quick Answer
The top government asset management KPIs include Facility Condition Index (FCI), Deferred Maintenance Ratio, PM Compliance Rate, Work Order Completion Rate, Mean Time to Repair (MTTR), Asset Utilization Rate, Cost per Work Order, Citizen Satisfaction Score, Energy Consumption per Asset, and Infrastructure ROI. Tracking these metrics with an AI-powered government analytics dashboard enables real-time decision-making, regulatory compliance, and measurable cost reduction.
Why Government Asset Management KPIs Matter More Than Ever
US & Canada
Massive Funding Gap
The American Society of Civil Engineers estimates the infrastructure funding gap runs into hundreds of billions annually. Canada's Federation of Municipalities identifies aging infrastructure as the single largest fiscal risk for local governments.
UK
Chronic Underinvestment
Local Government Association reports highlight persistent underinvestment in municipal assets. Without KPI tracking, councils cannot justify capital budgets or demonstrate accountability to taxpayers and elected officials.
Germany
Regulatory Compliance Pressure
Public asset management is governed by strict Kommunalrecht (municipal law) standards. Municipalities must demonstrate Wirtschaftlichkeit — economic efficiency — across all public services and infrastructure spending.
UAE
Smart Government Mandates
Dubai and Abu Dhabi smart government initiatives mandate digital performance dashboards for all major infrastructure assets. KPI reporting is a regulatory requirement, not an optional best practice.
All Regions
Visibility is the Real Problem
The challenge is not only funding — it is visibility. Without government analytics metrics, decision-makers cannot prioritize repairs, justify budgets, or prove value. KPIs turn operational chaos into structured, trackable data.
Top 10 Government Asset Management KPIs
01
Facility Condition Index (FCI)
Ratio of deferred maintenance cost to current replacement value. The foundational health score for any physical asset.
Formula Deferred Maintenance ÷ Replacement Value
Target Below 0.05 = Good | 0.05–0.10 = Fair | Above 0.10 = Poor
02
Deferred Maintenance Ratio
Measures how much maintenance has been postponed relative to total budget. Every dollar deferred today costs 3–5× more to fix later.
Target Below 10% of total maintenance budget
Used in UK Asset Management Plans (AMPs) — regulatory requirement
03
PM Compliance Rate
Percentage of scheduled preventive maintenance tasks completed on time. Below 70% means your agency is operating reactively.
Target 85% or higher
04
Work Order Completion Rate
Percentage of work orders closed within their target timeframe. High aging work orders signal hidden backlog and growing failure risk.
Target 90% or higher closed on time
Risk Overdue critical-asset WOs increase regulatory exposure and service disruption
05
Mean Time to Repair (MTTR)
Average time from asset failure to full service restoration. Directly impacts citizen satisfaction for roads, water, and transit.
Tracked by Municipal Benchmarking Network Canada (MBNC) as a core service delivery indicator
Improved by AI diagnostics that identify faults before technicians arrive on site
06
Asset Utilization Rate
What percentage of an asset's available capacity is being used productively. Low rates = wasted investment. Rates near 100% = accelerated wear.
Target 70–85% (varies by asset type)
Enables Right-sizing asset portfolios and deferring unnecessary capital acquisition
07
Cost per Work Order
Total maintenance spend divided by completed work orders. Benchmarks operational efficiency and reveals the financial impact of reactive versus preventive maintenance.
Target Trending downward year-on-year
Germany Required under New Public Management Wirtschaftlichkeit accountability standards
08
Citizen Satisfaction Score
Public rating of infrastructure service quality — captured through surveys, digital tools, and service request resolution data.
Target 75% or higher approval
Mandated in UK Local Government Transparency Code and Canada's Quality of Life Reporting System
09
Energy Consumption per Asset
Energy used per unit of asset output. Required by US, UK, Germany, and UAE sustainability mandates. AI flags anomalies in real time before waste escalates.
Target Year-on-year reduction
10
Infrastructure ROI
Economic and social return generated by capital invested in public assets relative to total lifecycle cost. The ultimate accountability metric for public spending.
Requires Integrated analytics combining operational data, maintenance costs, and service delivery outcomes
Modern platforms Calculate this continuously and automatically — not as a one-time exercise
Your Agency's KPI Gaps Are Costing You More Than You Know
iFactory's pre-deployment assessment analyzes your operational data, identifies underperforming KPI categories, and quantifies improvement potential before you commit to deployment.
Government Asset Management KPIs at a Glance
Scroll to see full table
| KPI |
What It Measures |
Target Benchmark |
Tracking Method |
| Facility Condition Index (FCI) |
Asset physical condition vs. replacement cost |
Below 0.05 (Good) |
Asset management platform |
| Deferred Maintenance Ratio |
Maintenance backlog vs. total budget |
Below 10% |
CMMS / AI analytics |
| PM Compliance Rate |
Scheduled maintenance completed on time |
85%+ |
Automated work order system |
| Work Order Completion Rate |
Work orders closed within target timeframe |
90%+ |
CMMS / government dashboard |
| Mean Time to Repair (MTTR) |
Time from failure to service restoration |
Varies by asset class |
IoT sensors + AI diagnostics |
| Asset Utilization Rate |
Productive use vs. total available capacity |
70–85% (asset dependent) |
Sensor monitoring / SCADA |
| Cost per Work Order |
Total maintenance cost per completed WO |
Trending downward |
ERP / analytics platform |
| Citizen Satisfaction Score |
Public rating of infrastructure service quality |
75%+ approval |
Survey tools / CRM integration |
| Energy Consumption per Asset |
Energy used per unit of asset output |
Year-on-year reduction |
Smart metering / IoT platform |
| Infrastructure ROI |
Economic / social return vs. lifecycle cost |
Positive and improving |
AI analytics dashboard |
Benchmarks are indicative. Verify against your agency's regulatory framework and asset class.
How AI Vision Enhances Government Asset Management
Computer vision (AI Vision) is among the most powerful tools in the modern public works technology stack — turning cameras, drones, and sensors into automated inspection and monitoring systems.
Visual Condition Assessment
AI analyzes images from cameras and drones to automatically score the condition of roads, bridges, pipes, and buildings — feeding results directly into FCI calculations. What took inspection teams weeks now takes hours.
Automated Defect Detection
When a camera detects a pothole, crack, or corroded joint, AI instantly generates a prioritized work order, assigns a crew, and updates the deferred maintenance dashboard — eliminating the manual reporting lag that lets defects compound.
Facility Utilization Monitoring
Anonymized video analytics measure real-time occupancy across public buildings, transit hubs, and community centers — feeding directly into Asset Utilization Rate KPI tracking. Germany municipalities use this to optimize energy and staffing schedules.
Safety & Compliance Monitoring
AI Vision detects unauthorized access, PPE violations, and hazardous conditions at infrastructure sites in real time — reducing incidents and supporting OSHA and HSE compliance reporting.
Book a demo to see AI Vision integration.
Choosing the Right Government Asset Management Platform
Tracking ten KPIs across a large municipal or state/federal asset portfolio requires more than a spreadsheet — it requires an integrated government analytics platform that connects operational data, maintenance records, IoT sensors, GIS mapping, and regulatory reporting into a single real-time view.
Key capabilities to look for in a government asset management system include: real-time KPI dashboards configurable by asset class, department, or geographic area; automated work order generation and PM scheduling; predictive maintenance powered by AI analytics; regulatory compliance reporting pre-configured for EPA, DWI, EU DWD, ADWEC, or provincial standards; and on-premise data processing to meet government cybersecurity and data sovereignty requirements.
iFactory delivers all of these capabilities through a platform that connects to existing SCADA, GIS, CMMS, and ERP systems — without replacing any current infrastructure. Deployment typically completes within 30 days, with measurable KPI improvement visible within the first quarter. Book a demo to see how the platform fits your agency's technology stack.
Benefits and ROI of Tracking Government Asset Management KPIs
30–40%
Reduction in Reactive Maintenance Costs
85%+
PM Compliance Rate Achievable
20–35%
Drop in Cost per Work Order
100%
Regulatory Compliance Maintained
30 days
Time to Full Platform Deployment
3–5×
Cost Multiplier for Deferred Maintenance
Common Challenges in Government KPI Tracking — and How to Solve Them
Challenge
Data Silos Across Departments
Most agencies run disconnected systems — GIS for mapping, CMMS for work orders, finance for budgets, spreadsheets for everything else. KPIs that need cross-system data become manual, error-prone, and stale before reaching a decision-maker.
Solution
Deploy an integration layer connecting existing systems via OPC-UA, MQTT, and REST API — presenting unified KPI dashboards without replacing any current infrastructure.
Challenge
Resistance to Digital Transformation
Public sector organizations face internal resistance driven by concerns about job displacement, learning curves, and procurement complexity. This slows adoption and delays measurable KPI improvement.
Solution
Start with read-only integration. Teams gain instant visibility into existing data — building trust before any process change is required. Early wins drive internal buy-in.
Challenge
Cybersecurity and Data Sovereignty
Government infrastructure data is classified as critical information in most jurisdictions. Cloud platforms transmitting this data externally face procurement barriers under NIST SP 800-82 (US), Cyber Essentials Plus (UK), BSI IT-Grundschutz (Germany), PIPEDA (Canada), and UAE IA Standards.
Solution
On-premise AI processing keeps all data within agency infrastructure — meeting cybersecurity and data sovereignty requirements with zero cloud dependency.
Best Practices for Implementing Government Asset Management KPIs
Start with FCI and Deferred Maintenance Ratio. These two KPIs establish the baseline health of your asset portfolio and provide the most compelling case for increased maintenance budgets — two outcomes most government asset managers urgently need.
Automate data collection where possible. Manual KPI reporting is slow, inconsistent, and resource-intensive. IoT sensors, automated work order systems, and AI analytics platforms turn continuous data streams into real-time KPI dashboards — with no manual data entry required.
Tie KPIs to budget cycles. KPIs that are not connected to budget allocation decisions become reporting exercises rather than management tools. Structure your government analytics dashboard so that KPI trends feed directly into annual budget requests, capital planning documents, and asset management plans.
Report publicly where required. Many jurisdictions — including UK councils under the Local Government Transparency Code and US municipalities under Open Government initiatives — are required to publish infrastructure performance data. A well-structured KPI framework makes compliance with transparency requirements straightforward rather than burdensome.
Benchmark against peers. KPIs in isolation tell you what is happening. Benchmarking against comparable agencies tells you whether your performance is acceptable. Networks like the Municipal Benchmarking Network Canada, the UK LGA, and the US Government Finance Officers Association publish benchmarking data for core public works KPIs.
Conclusion: From Reactive Management to Predictive Public Infrastructure
The shift from reactive to predictive government asset management is underway — driven by IoT connectivity, AI analytics, and rising public accountability standards. The ten KPIs outlined in this article are not just performance metrics — they are the language through which modern public works directors communicate infrastructure health, justify budget decisions, and demonstrate value to taxpayers and elected officials.
Whether you manage a small municipal portfolio in rural Canada, a network of public facilities across a German Landkreis, a sprawling utility infrastructure in the UAE, or a major urban public works department in the US or UK, the same principle applies: you cannot manage what you do not measure.
The technology to measure it — continuously, automatically, and cost-effectively — is available today. The agencies that deploy it now will operate with structural performance advantages that compound over time: lower maintenance costs, longer asset life, higher citizen satisfaction, and stronger regulatory compliance.
Measurable KPI Improvement. Quantified in Dollars. Deployed in 30 Days.
Connect iFactory to your existing SCADA, GIS, and CMMS systems in read-only mode. See your government asset management KPIs on a live dashboard within days. On-premise. Secure. Zero production impact.
Frequently Asked Questions
What is the most important KPI in government asset management?
The Facility Condition Index (FCI) is widely regarded as the primary KPI because it provides a single normalized score that reflects the overall health of any physical asset — regardless of type, size, or age. It is universally used in US, UK, Canadian, and Australian government asset management frameworks.
Book a demo to see FCI tracking in action.
How do government agencies track KPIs in real time?
Real-time KPI tracking requires an integrated government analytics platform that connects IoT sensors, SCADA systems, CMMS work order data, and GIS asset mapping into a unified dashboard. AI analytics then process this data continuously, updating KPIs without manual data entry. iFactory deploys this capability on-premise, with zero cloud dependency.
What is a good PM Compliance Rate for government agencies?
Industry best practice targets PM compliance rates of 85% or higher. Agencies below 70% are typically operating in a predominantly reactive maintenance mode, which significantly increases long-term costs and asset failure risk. AI-powered scheduling automation is the fastest proven path to improving PM compliance rates.
Can government KPI platforms comply with data sovereignty requirements?
Yes — on-premise platforms like iFactory process all data within agency infrastructure, with zero external cloud transmission. This architecture meets data sovereignty requirements under NIST SP 800-82 (US), Cyber Essentials Plus (UK), BSI IT-Grundschutz (Germany), PIPEDA (Canada), and UAE IA Standards.