Municipal performance measurement is no longer optional for governments under pressure to demonstrate public accountability, optimize limited budgets, and improve service delivery outcomes. Cities and counties that implement structured government performance KPIs consistently outperform peers in resident satisfaction, infrastructure uptime, and cost-per-service efficiency. Whether you are a city manager launching a performance tracking program for the first time or a department director refining existing government service metrics, this guide delivers the complete framework for building a measurement system that drives real operational improvement. Book a Demo to see how iFactory's analytics platform powers municipal performance tracking across public works, infrastructure, and citizen services.
Build a High-Performance Municipal Measurement System
iFactory helps government agencies design, deploy, and track performance measurement frameworks across every department—from public works and utilities to permitting, parks, and emergency response.
Why Municipal Performance Measurement Defines Modern Government Effectiveness
Government agencies face a governance challenge that private-sector organizations rarely encounter: demonstrating value to citizens who cannot choose alternative providers. Municipal performance measurement solves this challenge by creating objective, transparent evidence of service quality, operational efficiency, and resource stewardship. Without structured government performance tracking, departments operate on instinct rather than data—and budget allocations reward political visibility rather than measurable impact.
The shift toward performance-based government management has accelerated significantly. Federal programs including GASB Statement 54 compliance requirements, GFOA performance measurement frameworks, and ICMA's Center for Performance Analytics have established that rigorous public works performance data is now a baseline expectation for accountable local government. Municipalities that embed performance measurement into budget cycles, strategic planning, and departmental accountability structures consistently deliver better outcomes at lower cost per resident served.
The Four Pillars of Government Performance Measurement
Effective municipal KPIs are organized across four interdependent measurement pillars. Each pillar captures a distinct dimension of government performance—and together they provide a complete picture of how well a municipality is serving its residents and managing public resources. Agencies that measure across all four pillars avoid the common trap of optimizing one dimension at the expense of others, such as cutting cost while allowing service quality to deteriorate unnoticed.
Core Pillars of a Municipal Performance Framework
Service Delivery Performance
Measures the speed, reliability, and completeness of core municipal services—from pothole repair and permit processing to emergency response and utility maintenance. Service delivery metrics are the most visible government performance indicators to residents and carry the highest political weight in budget discussions.
Operational Efficiency KPIs
Tracks resource utilization rates, labor productivity, equipment deployment efficiency, and process cycle times. Operational efficiency metrics reveal where government service delivery is consuming disproportionate resources relative to output—creating targeted opportunities for cost reduction without service degradation.
Cost-Effectiveness Measurement
Calculates cost-per-service-unit across all municipal functions—cost per lane mile maintained, cost per building permit issued, cost per ton of waste collected. Cost-effectiveness government metrics enable direct peer benchmarking against comparable jurisdictions and track efficiency trends across budget cycles.
Citizen Satisfaction Indicators
Captures resident perception of service quality through structured surveys, complaint resolution rates, public meeting participation, and digital engagement metrics. Citizen satisfaction data provides the qualitative context that quantitative efficiency metrics cannot—bridging the gap between operational performance and community trust.
Essential Municipal KPIs by Department: What to Measure and Why
Government performance KPIs must be tailored to each department's specific service mandate, resource structure, and accountability relationships. Generic metrics applied uniformly across all functions fail to capture the operational realities that drive meaningful performance differences. The following department-by-department breakdown reflects best practices from ICMA, GFOA, and high-performing municipal programs across North America. Agencies looking to Book a Demo can see how iFactory's platform pre-configures department-specific KPI libraries for immediate deployment.
Municipal Performance KPIs by Service Area
| Department / Service Area | Key Performance Indicators | Target Benchmark | Measurement Frequency |
|---|---|---|---|
| Public Works & Roads | Pothole repair response time, cost per lane mile maintained, pavement condition index (PCI) | <48hr response / PCI ≥70 | Monthly / Quarterly |
| Water & Utilities | Water main break frequency, service restoration time, cost per 1,000 gallons delivered, compliance rate | 99.9% uptime / <4hr restoration | Real-time / Daily |
| Permitting & Licensing | Permit processing cycle time, first-pass approval rate, backlog clearance rate, applicant satisfaction score | <10 days / 85%+ approval rate | Weekly / Monthly |
| Parks & Recreation | Facility utilization rate, cost per program participant, maintenance response time, resident satisfaction | 65%+ utilization / <$35 per participant | Monthly / Seasonal |
| Emergency Services | Response time by priority, call-to-dispatch interval, on-scene arrival compliance, case resolution rate | <4min Priority 1 response | Real-time / Daily |
| Waste Management | Collection route completion rate, cost per ton collected, diversion rate, missed collection complaints | 98%+ on-time / 45%+ diversion | Weekly / Monthly |
How to Build a Municipal Performance Tracking System That Works
Most municipal performance measurement initiatives fail not because of poor metric selection, but because of inadequate system design—data collection that depends on manual entry, reporting cycles that are too slow to influence decisions, and KPI dashboards that are never reviewed by department leaders. Building a government performance tracking system that actually changes behavior requires a structured implementation approach aligned to how municipalities make decisions and allocate resources.
Step-by-Step: Implementing Government Performance Measurement
Align KPIs to Strategic Goals and Budget Cycles
Every KPI must trace directly to a strategic plan objective or service standard. Map each metric to its budget line, responsible department, and strategic goal before collecting data — so when performance deviates, the link to resource decisions is immediate and actionable.
Establish Data Collection Infrastructure
Automate data collection wherever possible. Integrate with existing work order systems, 311 platforms, and asset management databases. Agencies that automate data collection report 70–85% reductions in reporting time. Book a Demo to explore integration options.
Design Dashboards for Decision-Makers, Not Analysts
Build separate views for each audience: operational dashboards for supervisors (daily/weekly targets), management dashboards for directors (trends and exceptions), and public dashboards for residents (plain-language service metrics). The right data to the right person at the right time.
Embed Performance Reviews into Budget and Planning Cycles
Require department budget requests to include KPI trend data. Set monthly or quarterly review meetings where missed targets trigger specific corrective actions with follow-up timelines. Measurement only delivers ROI when it directly drives resource allocation decisions.
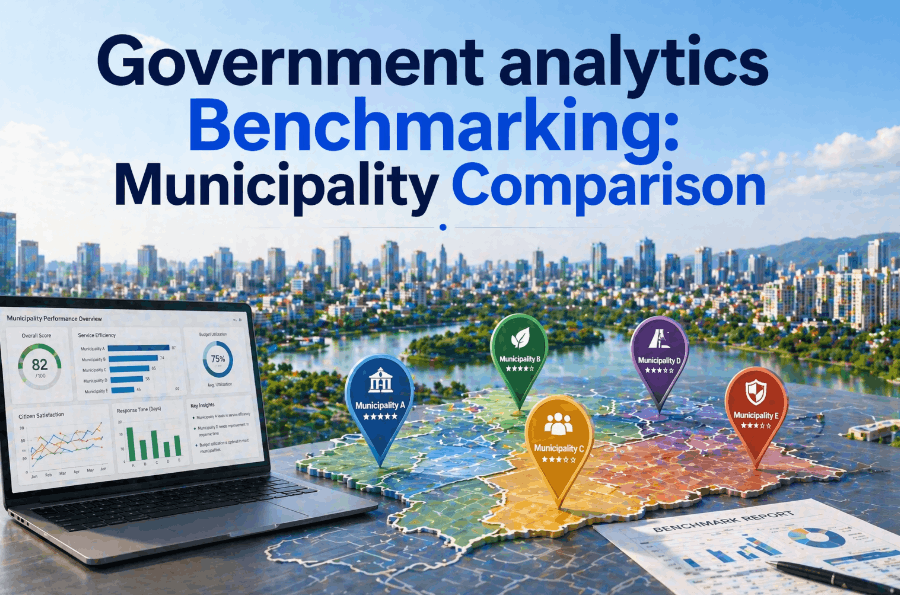
Municipal Performance Benchmarking: Comparing Your Government Metrics
Internal performance measurement tells you whether you are improving over time. Benchmarking against peer municipalities tells you whether your performance level is competitive—and reveals the efficiency gap between your current operations and best-practice standards. Government performance benchmarking is one of the most powerful tools available to municipal leaders seeking to make the case for operational investment or to demonstrate efficiency to residents and oversight bodies.
Organizations including ICMA, APWA, and the Alliance for Innovation publish annual benchmarking datasets covering hundreds of municipal service areas. State municipal leagues in most U.S. states maintain peer comparison databases that allow cost-per-service-unit comparisons adjusted for population density, geography, and service scope. Municipalities that participate in structured benchmarking programs consistently identify 10–25% cost reduction opportunities within 18 months—because cross-jurisdiction comparison reveals efficiency gaps that internal trend analysis cannot detect. To explore how iFactory's platform enables automated peer benchmarking for your specific KPI portfolio, Book a Demo with our government analytics team.
ICMA & APWA Datasets
Compare cost-per-service-unit metrics against national cohorts matched by population size, urbanization level, and regional cost index. Ideal for establishing baseline competitive positioning and identifying outlier performance in specific service areas.
State Municipal League Data
State-adjusted benchmarking accounts for local labor market rates, regulatory compliance costs, and geographic service delivery challenges. Provides the most defensible cost comparison for state legislative reporting and local media accountability inquiries.
Year-over-Year KPI Tracking
Longitudinal performance tracking reveals improvement trajectories, seasonal patterns, and the impact of specific operational or capital investments. Internal trend data is the most credible evidence base for departmental budget requests and performance-based compensation programs.
Continuous KPI Monitoring
Automated real-time dashboards replace monthly reporting cycles with continuous performance visibility. Real-time government service metrics enable same-day operational corrections rather than month-end incident reviews—dramatically reducing the cost of performance deviations across high-volume service departments.
Common Failures in Government Performance Measurement—and How to Avoid Them
Municipal performance programs fail in predictable patterns. Understanding these failure modes before implementation is the most cost-effective way to protect the investment and ensure that measurement produces genuine operational improvement rather than reporting compliance theater. The following failure patterns are documented across dozens of municipal program reviews and represent the most common reasons that government performance tracking initiatives are abandoned or discredited.
Measuring Activity Instead of Outcomes
Tracking inputs (inspections conducted, calls answered, hours logged) rather than outcomes (defects resolved, service restored, resident issues closed) creates a performance system that rewards effort regardless of results. Restructure KPIs around outcomes and citizen impact—not departmental activity volume.
Too Many Metrics, Too Little Focus
Municipal programs that launch with 40+ KPIs typically collapse under their own reporting burden within 18 months. Limit each department to 5–8 core metrics that directly reflect the highest-priority service and efficiency objectives. Fewer, better metrics with consistent review produce more behavioral change than comprehensive metric libraries that are never acted upon.
Disconnecting Measurement from Decisions
Performance data that is not linked to resource allocation, staffing decisions, or service standard changes is administrative overhead. If department directors cannot point to a specific decision that was changed because of KPI data, the measurement system is not functioning as a management tool—it is a compliance exercise. Build explicit decision triggers into the performance review process.
Manual Data Collection at Scale
Reliance on manual data entry for high-frequency operational metrics introduces latency, error, and staff burden that degrades data quality over time. When front-line staff perceive performance reporting as additional administrative work without clear operational benefit, data compliance deteriorates and reported metrics drift from operational reality.
Municipal Accountability: Publishing Performance Data for Resident Transparency
Public accountability through performance data transparency is increasingly a resident expectation and, in many jurisdictions, a legal requirement. Municipalities that proactively publish government service metrics build resident trust, reduce public records request burden, and establish credible evidence bases for budget advocacy. Performance transparency also creates productive external accountability—residents and journalists who can access clear, current performance data engage in more substantive policy discussions than those relying on anecdotal service experience.
Effective public performance reporting requires translation of operational KPIs into resident-accessible formats. Cost-per-lane-mile means little to the average resident; a simple statement that 94% of road maintenance requests were completed within the committed response window is immediately meaningful. The most successful municipal transparency portals pair plain-language performance summaries with underlying data downloads that satisfy the needs of journalists, researchers, and engaged residents simultaneously. For municipalities seeking to build automated performance transparency reporting into their KPI platform, Book a Demo to see iFactory's public-facing dashboard configuration options.
Frequently Asked Questions: Municipal Performance Measurement
What is municipal performance measurement and why does it matter?
Municipal performance measurement is the systematic collection, analysis, and reporting of quantitative indicators that reflect how well a local government is delivering services, managing resources, and achieving strategic goals. It matters because it replaces subjective judgment with objective data in budget decisions, service improvements, and public accountability reporting.
How many KPIs should a municipal government track?
Best practice frameworks from ICMA and GFOA recommend 5–8 core KPIs per department, with a citywide performance scorecard of 20–30 strategic indicators. Fewer, higher-quality metrics consistently outperform comprehensive measurement systems in terms of actual decision influence and staff engagement with performance data.
What is the difference between output metrics and outcome metrics in government?
Output metrics measure what a department produces (permits issued, tons of waste collected, miles of road patched). Outcome metrics measure the impact of that output on residents and community conditions (permit backlog cleared, landfill diversion rate, road condition index). High-performing municipal programs prioritize outcome metrics while using output data for operational management.
How do municipalities benchmark performance against peer cities?
ICMA's Insights platform, APWA benchmarking surveys, and state municipal league databases provide cost-per-service-unit comparison data adjusted for population, geography, and regional cost factors. Effective benchmarking requires normalizing for service scope differences—a city providing water, sewer, and electric service cannot directly compare costs with a city providing water service only.
How can technology improve municipal performance tracking?
Automated data collection through work order system integration, IoT sensor networks, and AI-powered inspection platforms eliminates manual reporting burden and enables real-time KPI visibility. Municipalities using integrated performance analytics platforms report 60–80% reductions in reporting preparation time and significantly faster operational response to performance deviations compared to spreadsheet-based reporting systems.
Ready to Modernize Your Municipal Performance Measurement?
iFactory's government analytics platform helps municipalities design, automate, and publish performance measurement programs that drive real operational improvement—with pre-built KPI libraries, real-time dashboards, peer benchmarking tools, and public transparency reporting across every department in your organization.