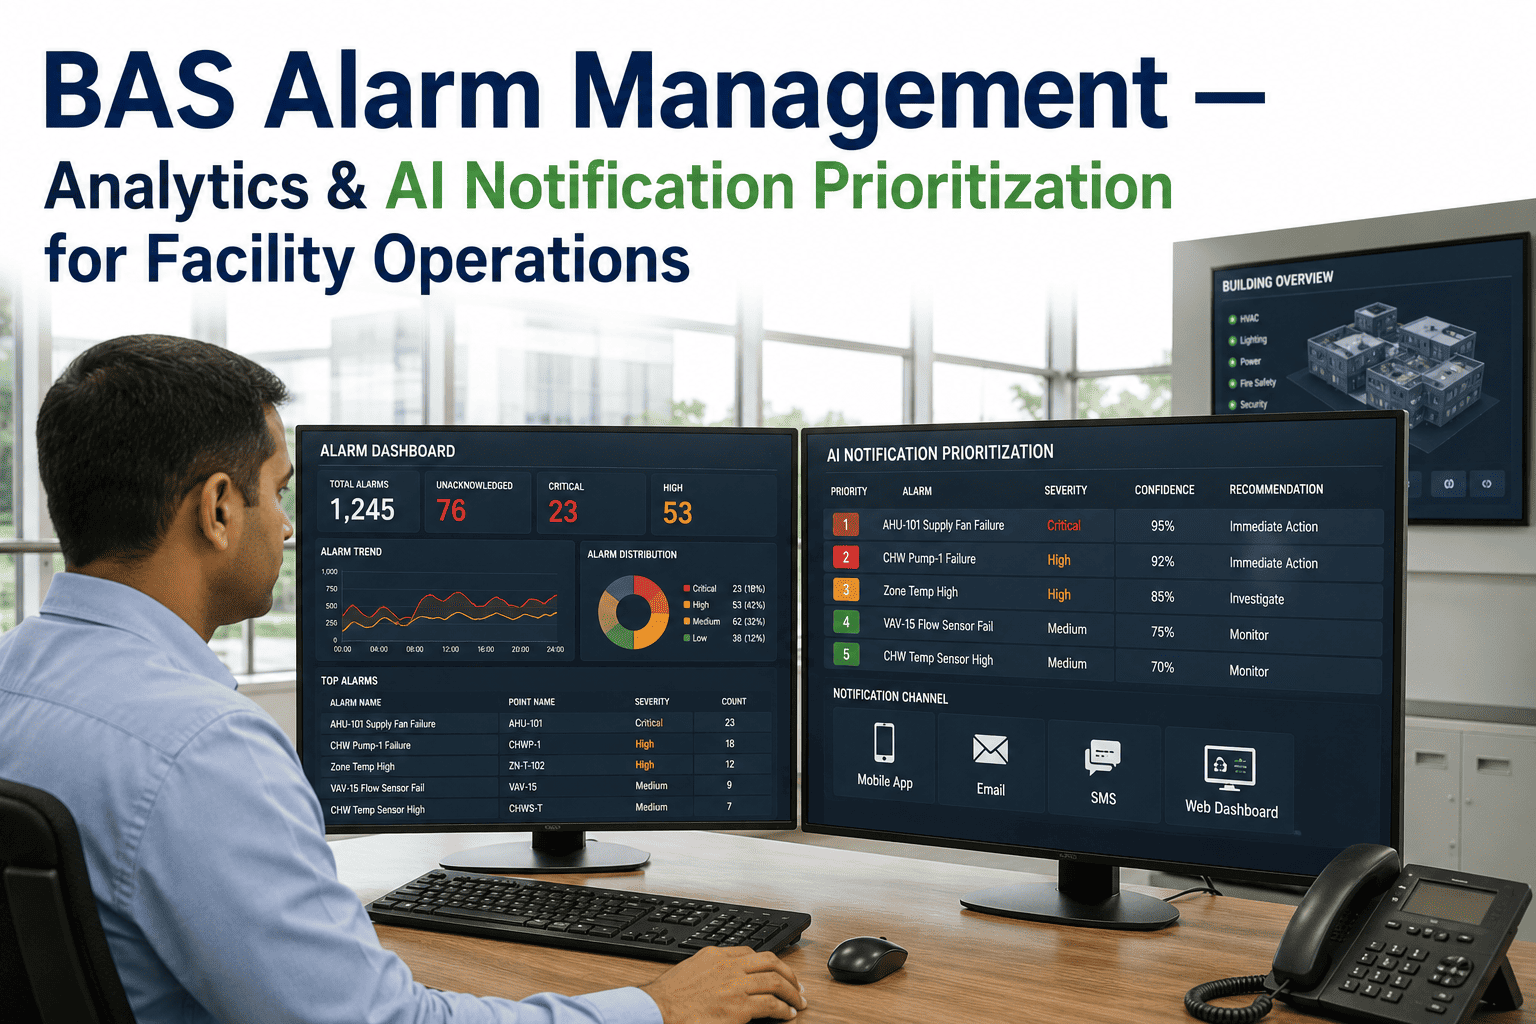
A facility operator scrolling through 400 unacknowledged BAS alarms on a Monday morning is not managing a building, they are triaging a backlog that stopped being useful weeks ago. Somewhere in that list is a genuine chiller fault worth responding to immediately, buried under nuisance alarms that reset themselves, flap on sensor noise, or trip on thresholds nobody has revisited since commissioning. iFactory helps facility teams separate the signal from that noise, and you can see the approach firsthand by choosing to book a demo with our team.
Most Building Alarms Never Needed a Human to Look at Them
The average commercial BAS generates far more alarms than any operations team can meaningfully review, and the overwhelming majority of them are nuisance events, sensor noise, transient thresholds, or duplicate notifications for the same underlying fault. iFactory applies AI notification prioritization and root cause correlation so operators respond to the handful of alarms that actually matter.
When Everything Is Urgent, Nothing Is
Alarm fatigue is a well-documented phenomenon in process industries and it applies just as directly to building operations. When an operator is exposed to a high volume of low-value alerts, their response behavior changes in a predictable and measurable way: acknowledgment times lengthen, alarms get dismissed in batches without individual review, and eventually a genuinely urgent alarm gets treated with the same casual dismissal as the nuisance alerts surrounding it. This is not a discipline problem or a training gap, it is a well-understood human response to sustained alert overload, and it happens to careful, experienced operators just as often as new ones.
The pattern tends to be worst on buildings that have accumulated alarm configuration debt over many years, additional points added during retrofits, sensors replaced with slightly different default thresholds, and setpoints copied from a template building that never quite matched local conditions. None of these additions individually looked like a problem at the time they were made, but stacked together over a decade of incremental changes they produce an alarm environment that no single person fully understands or can explain, which is exactly the environment where fatigue takes hold fastest.
The financial cost compounds quietly. A chiller alarm dismissed along with a batch of nuisance alerts can mean hours of degraded operation before anyone notices independently, either through a comfort complaint or a bigger downstream failure. A refrigerant leak alarm treated the same way can mean a compliance exposure that grows the longer it goes unaddressed. None of these outcomes trace back to a single mistake, they trace back to an alarm environment that made the important alert indistinguishable from the unimportant ones.
Facility managers who audit their alarm logs for the first time are consistently surprised by how skewed the distribution actually is. A small number of alarm points are typically responsible for the overwhelming majority of total alarm volume, meaning the fastest path to a manageable alarm environment is rarely a wholesale system redesign, it is identifying and fixing the small number of chronically noisy points generating most of the fatigue in the first place.
One Fault, Twelve Alarms, and Why That Math Matters
A single mechanical fault upstream in a system can trigger a cascade of downstream alarms across multiple connected points, a failing supply fan can generate a low airflow alarm, a static pressure alarm, several zone temperature alarms, and a high humidity alarm, all from one root cause. An operator working through an unfiltered alarm list sees twelve separate problems and has no immediate way to know they are looking at one fault, not twelve, which wastes investigation time and delays the fix that would resolve every downstream symptom at once.
Root cause correlation analyzes the timing, sequence, and system topology relationships between alarms to group cascading events under their originating fault, presenting the operator with one prioritized incident instead of a dozen unrelated-looking alerts. This is fundamentally a pattern recognition problem, one well suited to machine learning models trained on historical alarm sequences, since the relationships between cascading alarms in a given building's specific system topology are rarely documented anywhere a rules engine could reference them directly.
| Alarm Management Approach | How It Handles Volume | Where It Falls Short |
|---|---|---|
| No Filtering, Raw Alarm Feed | Operator sees every event as it occurs | Overwhelming volume drives fatigue and missed critical alarms |
| Static Priority Levels | Alarms tagged critical, high, low at configuration time | Priority never adjusts to context, time of day, or cascading patterns |
| Rules-Based Suppression | Manually defined rules mute known nuisance points | Requires constant manual upkeep as equipment and patterns change |
| AI Prioritization and Correlation | Learns nuisance patterns and root cause relationships continuously | Requires historical alarm data to reach full accuracy |
Find Out How Much of Your Alarm Volume Is Actually Noise
iFactory analyzes your historical alarm log to show which points are driving fatigue and which alarms genuinely need operator attention.
Four Inputs That Determine Whether an Alarm Deserves Immediate Attention
Effective prioritization is not a single severity tag assigned once at configuration time, it is a live score calculated from several factors that change constantly. A model that only considers the alarm's originally configured severity level behaves no better than a static priority system, since it cannot account for context that changes minute to minute, like whether the affected zone is currently occupied or whether a related system is already flagged for maintenance.
Why Alarm Prioritization Projects Fail Even When the Technology Works
The most common reason a well-built alarm prioritization system fails to deliver lasting value has nothing to do with the underlying algorithm, it is operator trust. If facility staff experience even a handful of instances where a suppressed or deprioritized alarm turns out to have mattered, trust in the system erodes quickly, and operators revert to manually reviewing the full unfiltered alarm stream, which defeats the entire purpose of the deployment.
Trust also erodes in the opposite direction when a system floods operators with justification text for every single filtering decision, since that simply trades one form of information overload for another. The balance that works best in practice gives operators a quiet, uncluttered priority queue by default, with the full reasoning and correlation trail available on demand for any alarm they want to dig into, rather than forcing that detail on them for every event whether they asked for it or not.
Building that trust requires transparency in how prioritization decisions are made, giving operators visibility into why an alarm was deprioritized rather than presenting a black-box filtered list, and it requires a deliberately conservative rollout, starting with suppression only of alarm patterns with a long, well-documented history of being nuisance events, and expanding coverage gradually as confidence in the model's accuracy builds over time. Facility managers who treat this as a change management project alongside a technology deployment see meaningfully better long-term adoption than those who treat it purely as a software rollout.
It also helps to give operators an easy path to flag a false suppression when they spot one, since every correction fed back into the model improves its accuracy for that specific building's alarm patterns going forward. Treating the rollout as a one-time configuration exercise rather than an ongoing feedback loop is one of the more common reasons prioritization accuracy plateaus below where it could reasonably reach.
The Same Data That Prioritizes Today's Alarms Can Predict Tomorrow's
Once an alarm history is being systematically correlated and categorized rather than treated as a disposable notification stream, it becomes a genuinely valuable dataset for something beyond real-time triage: predicting which equipment is trending toward failure before it generates a critical alarm at all. A chiller that has been producing a slowly rising frequency of minor, individually low-priority alarms over several weeks is very often signaling a developing mechanical issue, even though no single alarm in that sequence would have triggered an urgent response on its own.
This is the difference between alarm management as a reactive filtering exercise and alarm management as an early warning system. The former reduces noise so operators can respond faster to what already went wrong. The latter uses the accumulated pattern of low-priority alarms to flag equipment worth a proactive maintenance inspection before it fails outright, closing the loop between BAS alarm data and the maintenance planning process that, in most buildings, currently runs on a completely separate schedule with no connection to real-time alarm trends.
Facility managers who reach this stage of maturity in their alarm program typically find that the biggest remaining barrier is organizational rather than technical, connecting the alarm analytics platform to the CMMS or work order system so a predictive flag actually turns into a scheduled maintenance task, rather than sitting in a dashboard nobody outside the BAS team ever looks at. Closing that last integration gap is often what separates a program that reduces noise from one that also reduces unplanned equipment failures.
What Changes in the First Month Versus the First Quarter
Facility teams evaluating this kind of deployment benefit from understanding the realistic timeline for different types of improvement, since expecting quarter-level gains in the first week sets a project up to be judged unfairly before the model has had time to learn the building's specific patterns. The most immediate improvement, often visible within days of deployment, is deduplication and chronic-offender suppression, since these are pattern types with well-established signatures that do not require months of building-specific learning to identify accurately.
Root cause correlation across less common cascading fault patterns takes longer to reach high confidence, since the model needs enough historical examples of a specific cascade actually occurring to recognize it reliably rather than guessing at a relationship that has not yet been observed enough times. Predictive maintenance flagging, which depends on recognizing subtle multi-week trend patterns rather than immediate signatures, is realistically a longer-horizon capability that matures over a full seasonal cycle as the model observes how alarm patterns shift with weather, occupancy, and equipment aging.
Questions Facility Managers Ask About AI Alarm Prioritization
Give Your Operators an Alarm List They Can Actually Trust
iFactory turns a noisy BAS alarm stream into a prioritized, correlated queue so facility teams respond to what matters and stop drowning in what doesn't.