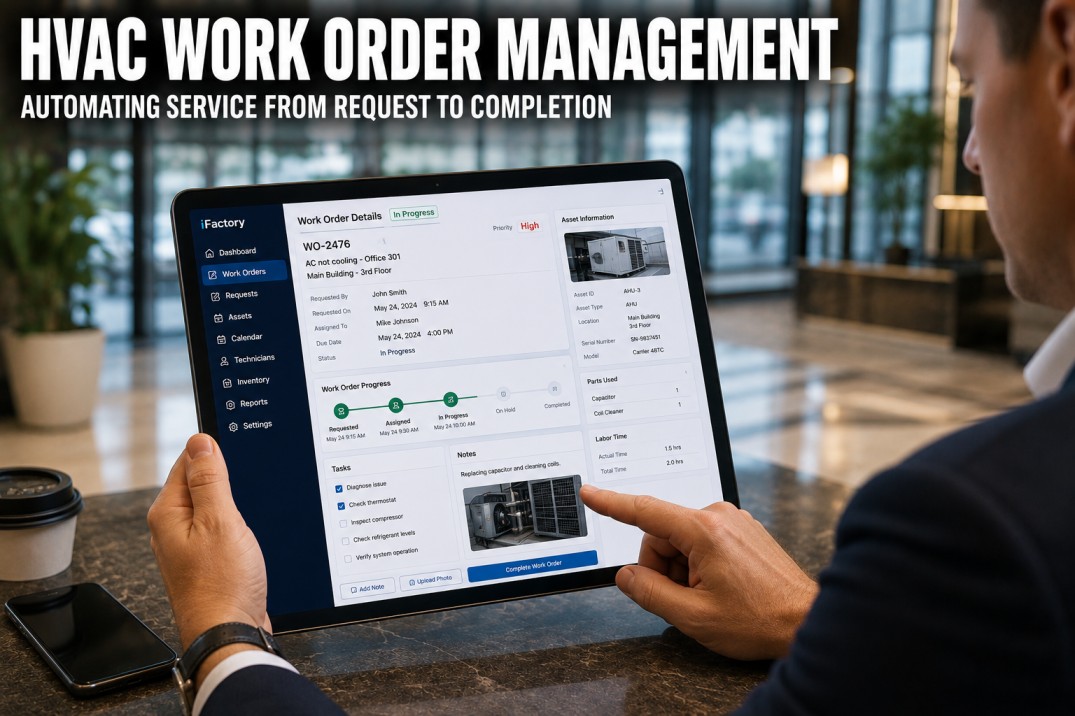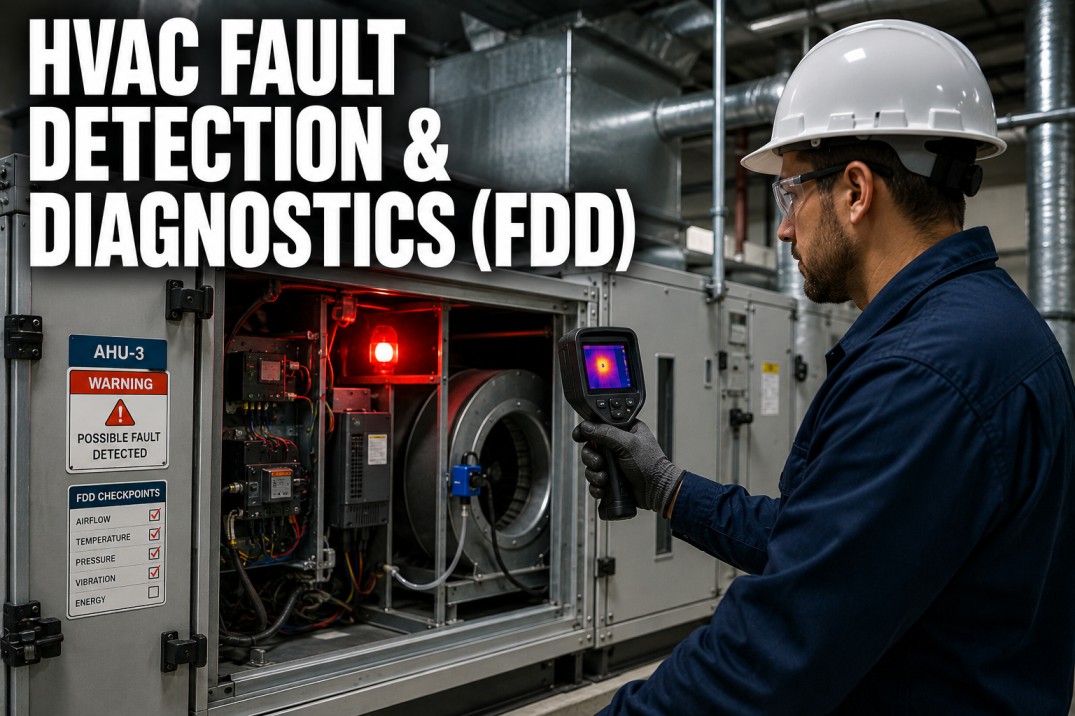
Fault Detection and Diagnostics (FDD) is the automated process of identifying HVAC equipment problems from subtle performance degradation to imminent failures by continuously comparing actual operation against expected behavior. Unlike traditional maintenance that relies on scheduled inspections and occupant complaints, FDD catches soft faults sensor drift, stuck dampers, economizer failures, control sequence errors, and refrigerant leaks weeks or months before they would be noticed through manual inspection.
Automate HVAC Fault Detection With Predictive Analytics Console
iFactory's Predictive analytics Console provides automated FDD across all equipment types, detecting soft faults 4-12 weeks before manual discovery. Book a demo to see how automated fault detection eliminates diagnostic guesswork.
HVAC Fault Types: Soft Failures, Hard Failures & Performance Degradation
FDD systems detect three categories of faults, each with different detection difficulty and business impact.
Soft Faults (Performance Drift)
Gradual degradation: sensor calibration drift, duct leakage, coil fouling, filter loading, refrigerant charge migration. Detectable 4-12 weeks before impact. Energy impact: 5-15% increase. Most common: sensor drift affects 30% of sensors within 5 years.
Hard Faults (Component Failure)
Sudden failure: compressor lockout, fan burnout, belt breakage, control board failure. Detectable at failure. Energy impact: 100% capacity loss. Most common: electrical component failure accounts for 35% of HVAC breakdowns.
Sequence & Control Errors
Incorrect operation: simultaneous heating/cooling, stuck economizer, wrong schedule, staging errors, VAV failure. Detectable within days. Energy impact: 10-25% increase. Most common: simultaneous heating/cooling affects 15-25% of buildings.
FDD Detection Methods: Rule-Based vs Machine Learning
FDD implementations range from simple threshold rules to sophisticated ML models.
| Method | How It Works | Setup Complexity | Detection Accuracy | Best For |
|---|---|---|---|---|
| Threshold Rules | Alert when value exceeds limit | Low (hours) | 60-70% | Simple detection, minimal data |
| Rule-Based (Expert) | HVAC engineering rules applied | Medium (days) | 75-85% | Known failure modes, standard equipment |
| Statistical Process Control | Alert when variance exceeds 3 sigma from baseline | Medium (1-2 weeks) | 80-90% | Stable operation, gradual degradation |
| Autoencoder ML | Learns normal, flags anomalies | High (2-4 weeks data) | 85-95% | Complex systems, novel faults |
| Hybrid (Rule + ML) | Rules cover known, ML detects novel | High (setup + training) | 90-97% | Comprehensive coverage, best performance |
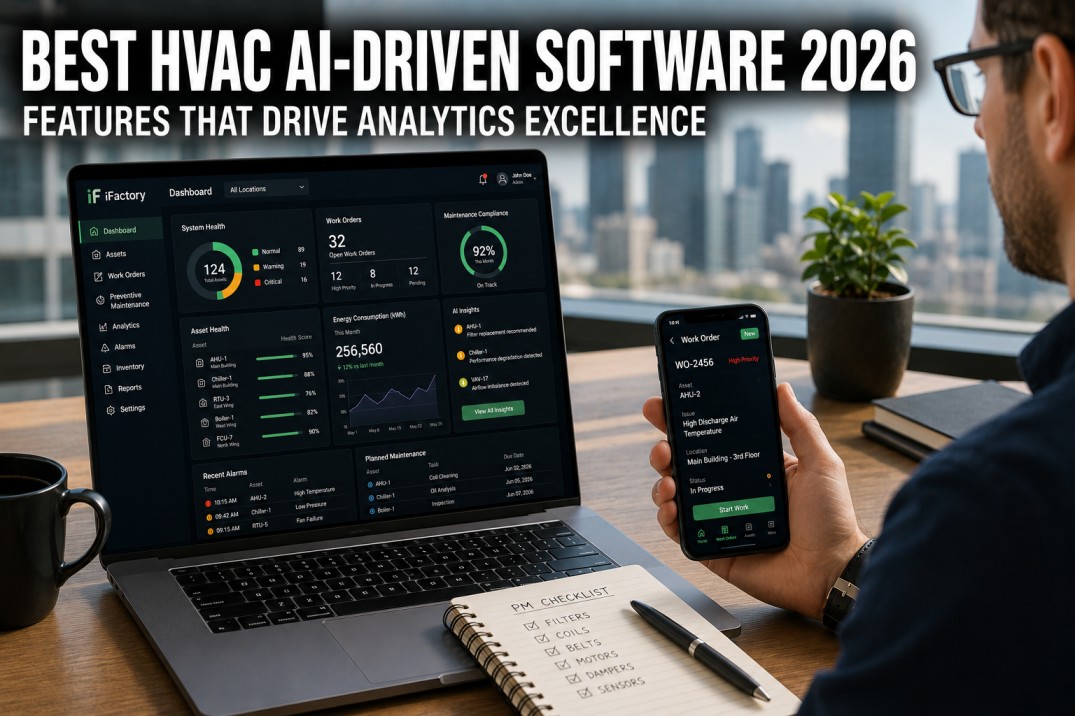
From Fault Detection to Root Cause in Seconds
iFactory's platform not only detects faults but diagnoses root causes and recommends corrective actions. Book a demo to see how diagnostic depth transforms alerts into actionable work orders.
Diagnostic Depth: From Fault Alert to Root Cause Analysis
Value increases with diagnostic depth: knowing what is wrong is valuable; knowing why and what to do transforms maintenance.
Level 1: Alert Only
"Chiller efficiency low" notifies operator without diagnostic info. Requires experienced technician to investigate. Value: reduces time to awareness from weeks to hours. Most common in basic BMS alarming.
Level 2: Diagnostics Included
"Chiller efficiency low = condenser fouling. Approach temp >15F. Recommend tube cleaning." Provides root cause and action. Enables less experienced staff to respond correctly.
Level 3: Prediction + Prescription
"Condenser fouling progressing. Tube cleaning needed in 6 weeks. Schedule during planned downtime before June 15." Predicts future state and optimal timing using ML models.
FDD Implementation: Phased Approach From Pilot to Enterprise
Start with critical equipment, prove value, then scale systematically across the portfolio.
Phase 1: Pilot & Foundation
Begin with 5-10 critical units. Audit existing BMS points to identify available sensors, data accessibility, and coverage gaps. Install supplementary sensors on pilot units. Configure the data pipeline for reliable collection at 1-5 minute intervals. Deploy rule-based FDD with expert rules for known fault types. This phase delivers the first measurable results within 8-12 weeks.
Phase 2: Operationalize & Scale
Train facility staff on responding to FDD alerts. Measure pilot results: faults detected, energy savings, response time improvements. Scale deployment to remaining units based on pilot lessons. Integrate with work order systems to automate generation from confirmed alerts.
Phase 3: Advanced Analytics & Optimization
Add ML models by training autoencoders on 4-8 weeks of data per unit. Enable predictive failure forecasting. Refine alert thresholds based on false positive patterns. Optimize work order generation with priority scoring based on business impact.
FDD Savings Metrics: Measurable Results Across Building Types
Published case studies demonstrate consistent savings from FDD deployment.
Energy Savings
FDD identifies 15-30 faults per 100K sq ft in year one. Each fault corrected saves 1-3% of HVAC energy. Average year-1: 12%. 80% of savings persist in year 2+.
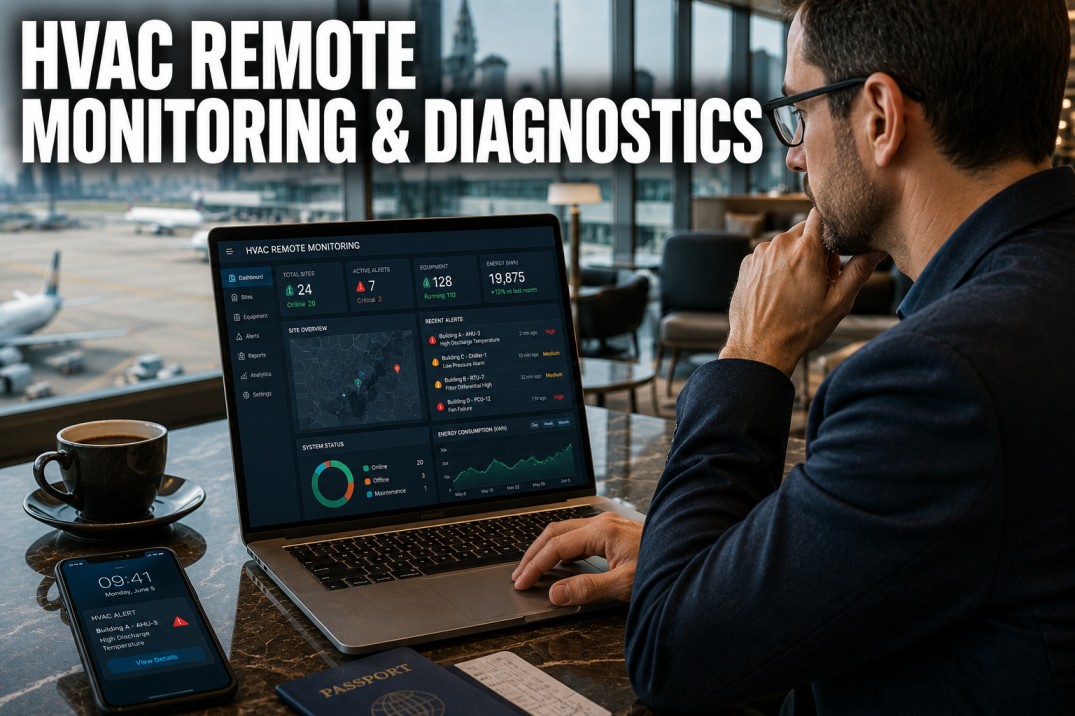
Mean Time to Detect
FDD detects faults 4-12 weeks before manual discovery. Economizer failures: 2-5 days vs 6-18 months. Sensor drift: 1-3 weeks vs 2-5 years.
Service Call Reduction
Converts emergency repairs to planned maintenance. Emergency to planned ratio shifts from 60:40 to 25:75 within 12 months.
Cost per Detected Fault
Annual platform cost divided by actionable faults detected. Compare to manual: $50-200 per fault in technician diagnostic time. FDD is 4-10x more cost-efficient.
Frequently Asked Questions
What is HVAC Fault Detection and Diagnostics (FDD)?
FDD is an automated system that continuously monitors HVAC equipment data, identifies when equipment is operating outside normal parameters, determines root cause, and recommends corrective actions. FDD differs from BMS alarming three ways: it detects problems before safety limits (soft faults), diagnoses underlying cause not just symptom, and prioritizes by business impact. Comprehensive FDD monitors 50-200+ fault conditions per equipment.
What faults can HVAC FDD detect?
Soft faults: sensor drift (30% drift >3F within 5 years), stuck economizer (40-60% of buildings), filter loading, duct leakage, coil fouling, refrigerant charge issues (18% of units), valve leakage. Hard faults: compressor failure, fan burnout, belt breakage, electrical failure, refrigerant leak. Control faults: simultaneous heating/cooling (15-25% of buildings), schedule errors (70% start too early), VAV failure (20-30% of boxes).
What is the difference between FDD and predictive analytics?
FDD identifies problems that currently exist: "What is wrong right now?" Predictive analytics forecasts future problems: "What will fail and when?" FDD uses pattern recognition and rules; predictive uses ML models trained on failure data. FDD detects soft faults 4-12 weeks before manual discovery; predictive predicts hard failures 3-6 weeks before occurrence. Most platforms include both.
How much does HVAC FDD software cost?
Basic rule-based FDD: $0.02-0.05/sq ft/yr. Advanced ML-enhanced: $0.05-0.12/sq ft/yr. Enterprise comprehensive: $0.10-0.20/sq ft/yr. Implementation: $5K-25K pilot, $25K-75K enterprise. Total year-1: $0.07-0.25/sq ft. Savings: $0.15-0.60/sq ft. Payback: 6-18 months.
How do I implement FDD in my building?
Start with readiness assessment: audit BMS points and sensor coverage. Most buildings have 60-80% of needed data. Fill gaps for critical equipment. Select cloud-based rule+ML hybrid platform. Pilot on 5-10 critical units for 8-12 weeks. Measure results: faults detected, energy savings, response time. If ROI positive, scale to remaining equipment over 12-24 months.
Detect, Diagnose, and Resolve HVAC Faults Faster
iFactory's Predictive analytics Console delivers comprehensive FDD including rule-based and ML detection, root cause diagnostics, and work order integration. Book a demo to see how automated FDD transforms maintenance.