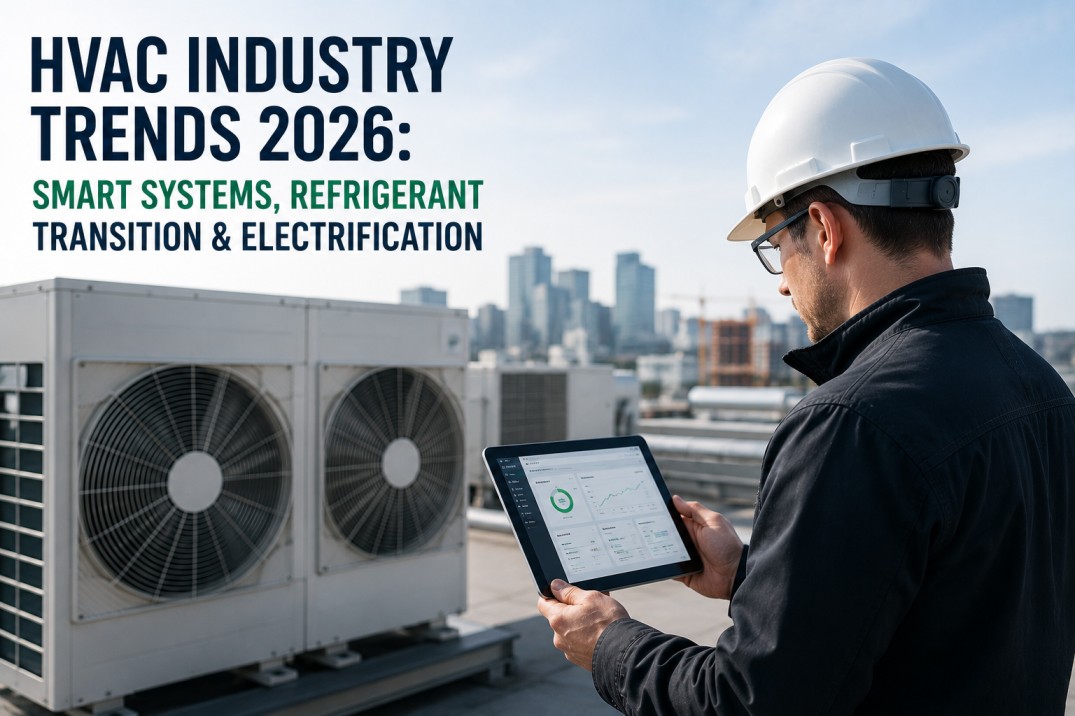
The global HVAC market is projected to reach $333 billion in 2026, growing at a compound annual growth rate of 7.4 percent from 2024 to 2030, driven by rising construction activity, building electrification mandates, refrigerant transition requirements, smart HVAC technology adoption, and increasing demand for energy-efficient climate control solutions across residential, commercial, and industrial sectors worldwide. This comprehensive market analysis examines the five critical dimensions shaping the HVAC industry in 2026: the Market Size Overview quantifying total market value, growth trajectory, and segment breakdown across heating, ventilation, air conditioning, and refrigeration equipment categories with year-over-year growth comparisons; the Regional Market Analysis comparing North America, Europe, Asia-Pacific, Middle East and Africa, and Latin America markets with country-level breakdowns, growth drivers, and regulatory influences specific to each region; the Equipment vs Services Market Split analyzing the revenue distribution between HVAC equipment sales, installation, maintenance, and energy services that reveals the growing share of service-based revenue; the Market Growth Drivers identifying the four primary forces fueling HVAC market expansion including building electrification policies, regulatory compliance requirements, smart building technology adoption, and construction activity recovery with quantified market impact for each driver; and the Segment Growth Metrics profiling eight HVAC product categories with market sizes, growth rates, and technology trends that property owners and facility managers can use to benchmark their investment decisions against industry-wide adoption patterns. By understanding these five market dimensions, building owners, investors, and facility professionals can align their HVAC capital planning with market trends, identify the fastest-growing technology segments for strategic investment, evaluate regional cost and availability dynamics, and make procurement decisions that optimize total cost of ownership while positioning their properties for the evolving HVAC technology landscape.
Benchmark Your HVAC Investments Against Global Market Trends
iFactory's analytics platform provides HVAC market benchmarking, equipment cost tracking, regional comparison tools, and investment planning models that help property managers align capital planning with industry trends. Book a demo to see how market intelligence drives smarter HVAC investment decisions.
Global HVAC Market Size — $333 Billion Industry in 2026
The global HVAC market has reached $333 billion in 2026, reflecting robust growth across all major segments and regions as building electrification, refrigerant transition, and smart technology adoption drive equipment replacement and new installation demand. The overview cards below break down total market value, growth trajectory, and primary segment contributions.
Regional HVAC Market Breakdown — North America, Europe, Asia-Pacific, and Rest of World
The HVAC market varies significantly across regions due to differences in construction activity, climate conditions, regulatory environments, technology adoption rates, and economic development levels. The regional analysis table below compares five major markets with detailed country-level breakdowns and growth drivers for each region.
| Region | Market Size 2026 | CAGR | Leading Country | Primary Growth Drivers |
|---|---|---|---|---|
| Asia-Pacific | $148B (44.4%) | 8.8% | China ($68B), India ($24B), Japan ($18B) | Urbanization, manufacturing growth, air quality regulations, middle-class expansion |
| North America | $92B (27.6%) | 6.2% | United States ($78B), Canada ($14B) | AIM Act phasedown, IRA incentives, building electrification mandates, replacement cycle |
| Europe | $64B (19.2%) | 6.8% | Germany ($18B), UK ($12B), France ($10B) | F-Gas regulation, REPowerEU, heat pump adoption push, carbon pricing |
| Middle East & Africa | $18B (5.4%) | 7.2% | Saudi Arabia ($6B), UAE ($5B), South Africa ($3B) | Mega construction projects, extreme climate, tourism/hospitality growth |
| Latin America | $11B (3.3%) | 5.4% | Brazil ($5B), Mexico ($3B), Colombia ($1.5B) | Construction recovery, middle-class growth, temperature-driven demand |
Compare HVAC Costs and Market Trends Across Regions
iFactory's platform provides regional HVAC market intelligence, equipment cost benchmarking, regulatory compliance tracking, and investment planning tools for multi-market property portfolios. Book a demo to see how market analysis informs smarter HVAC procurement and capital planning decisions.
Equipment vs Services Market Split — Revenue Distribution and Shifting Dynamics
The HVAC market is increasingly driven by service-based revenue as equipment-as-a-service models, performance contracting, and smart HVAC monitoring shift the industry from transactional equipment sales to recurring service relationships. The split analysis below breaks down the $333 billion market into equipment, installation, maintenance, and energy services categories.
Market Growth Drivers — Four Forces Shaping HVAC Industry Expansion
Four primary growth drivers are fueling the HVAC market expansion to $333 billion in 2026, each contributing measurable market value through distinct mechanisms. The driver cards below quantify the market impact of each force with specific revenue contributions and projected growth trajectories.
Segment Growth Metrics — HVAC Product Categories, Market Sizes, and Growth Rates
The HVAC market comprises multiple product categories with significantly different growth trajectories driven by technology trends, regulatory requirements, and end-user demand patterns. The growth metric cards below profile eight key HVAC product categories with their 2026 market sizes, growth rates, and dominant technology trends.
Frequently Asked Questions About the Global HVAC Market in 2026
What is the global HVAC market size in 2026?
The global HVAC market is projected to reach $333 billion in 2026, growing at a compound annual growth rate of 7.4 percent from $278 billion in 2024, driven by building electrification mandates, refrigerant transition requirements, smart technology adoption, and new construction activity across all major regions. The market is divided into commercial HVAC which represents the largest segment at $173 billion or 52 percent of total market value, residential HVAC at $122 billion or 37 percent, and industrial HVAC at $38 billion or 11 percent. Equipment sales account for $143 billion or 43 percent of market revenue including HVAC units, heat pumps, furnaces, chillers, boilers, air handlers, and VRF systems. Installation services contribute $77 billion or 23 percent covering new construction and retrofit installation labor, commissioning, and project management. Maintenance and repair services represent $80 billion or 24 percent, growing faster than equipment sales at 8.2 percent CAGR as service contracts and predictive maintenance programs expand. Energy services and HVAC-as-a-Service subscriptions, though the smallest category at $33 billion or 10 percent, are the fastest-growing segment at 14.5 percent CAGR as building owners shift from capital equipment ownership to performance-based service models. The Asia-Pacific region leads global HVAC market share at $148 billion or 44.4 percent, followed by North America at $92 billion or 27.6 percent, Europe at $64 billion or 19.2 percent, the Middle East and Africa at $18 billion or 5.4 percent, and Latin America at $11 billion or 3.3 percent. The market is projected to reach $472 billion by 2030, with heat pumps, controls and building automation systems, and HVAC-as-a-Service emerging as the fastest-growing segments at 12.4 percent, 11.2 percent, and 14.5 percent CAGR respectively.
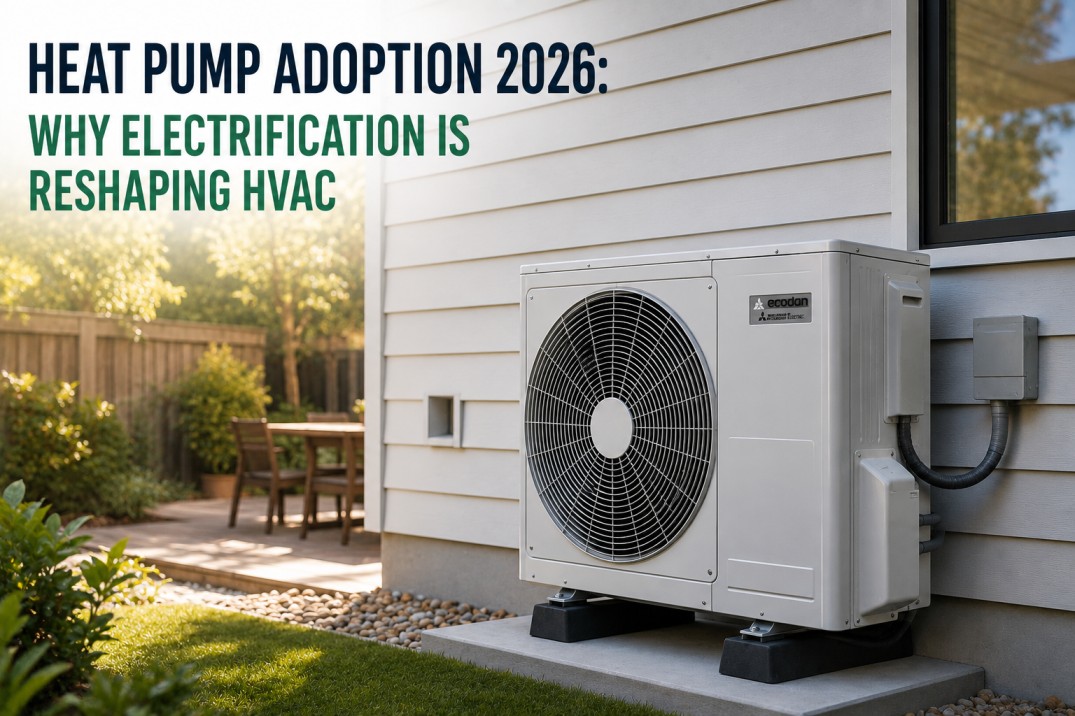
Which HVAC market segments are growing fastest in 2026?
The fastest-growing HVAC market segments in 2026 are led by HVAC-as-a-Service and energy services growing at 14.5 percent CAGR, reflecting the structural shift from equipment ownership to subscription-based service models that align costs with value delivery. Heat pumps are the fastest-growing equipment category at 12.4 percent CAGR, driven by building electrification mandates, federal tax incentives of up to $2,000 per residential unit, cold-climate performance breakthroughs maintaining full capacity at minus 25 degrees Celsius, and commercial building performance standards in 15 states. Controls and building automation systems are growing at 11.2 percent CAGR as AI-powered diagnostics, IoT predictive maintenance, digital twin simulation, and autonomous optimization become standard features in new commercial HVAC installations. VRF variable refrigerant flow systems continue their strong growth at 9.4 percent CAGR, driven by heat recovery capability that simultaneously heats and cools different building zones, space efficiency for retrofit applications, and R-32 refrigerant adoption that improves efficiency by 5 to 8 percent compared to R-410A. By contrast, traditional furnaces and boilers are the slowest-growing segment at 1.8 percent CAGR as electrification policies phase out natural gas equipment in major markets, though condensing efficiency improvements and hydrogen-ready hybrid systems are sustaining replacement demand. Chillers are growing at a moderate 5.8 percent CAGR with magnetic bearing and heat pump chiller variants outperforming the category average. Commercial refrigeration is growing at 6.5 percent CAGR driven by CO₂ transcritical system adoption and cold chain logistics expansion. The maintenance and repair services segment at 8.2 percent CAGR benefits from the technician workforce shortage that is raising service prices by 6 to 10 percent annually and the growing complexity of smart HVAC systems requiring specialized diagnostic skills.
Which region leads the global HVAC market in 2026?
The Asia-Pacific region leads the global HVAC market in 2026 with $148 billion in revenue representing 44.4 percent of total market value, growing at 8.8 percent CAGR, driven by rapid urbanization, manufacturing expansion, rising middle-class incomes, and worsening air quality driving demand for air conditioning and ventilation systems. China is the single largest national HVAC market at $68 billion, accounting for 46 percent of the Asia-Pacific total and 20 percent of global HVAC spending, with growth fueled by government green building programs, the refrigerant transition from R-22 to R-32, and expansion of the commercial building sector in tier-2 and tier-3 cities. India is the fastest-growing major HVAC market globally at 12.2 percent CAGR, reaching $24 billion in 2026, driven by 7.2 percent GDP growth, a construction boom adding 500 million square feet annually, rising heat index temperatures increasing cooling demand, and government initiatives including the India Cooling Action Plan targeting 20 to 25 percent reduction in cooling energy demand by 2038. Japan at $18 billion and South Korea at $8 billion represent mature markets with replacement-driven demand and high adoption of advanced VRF and heat pump technology. North America is the second-largest region at $92 billion or 27.6 percent market share, growing at 6.2 percent CAGR, with the United States at $78 billion driven by AIM Act refrigerant phasedown compliance, Inflation Reduction Act heat pump incentives, and commercial building electrification mandates in major cities. Europe at $64 billion or 19.2 percent is growing at 6.8 percent CAGR, led by Germany at $18 billion and the United Kingdom at $12 billion, with the F-Gas regulation phasedown and REPowerEU heat pump deployment targets of 20 million additional heat pumps by 2027 driving equipment replacement and new installation demand across the region.
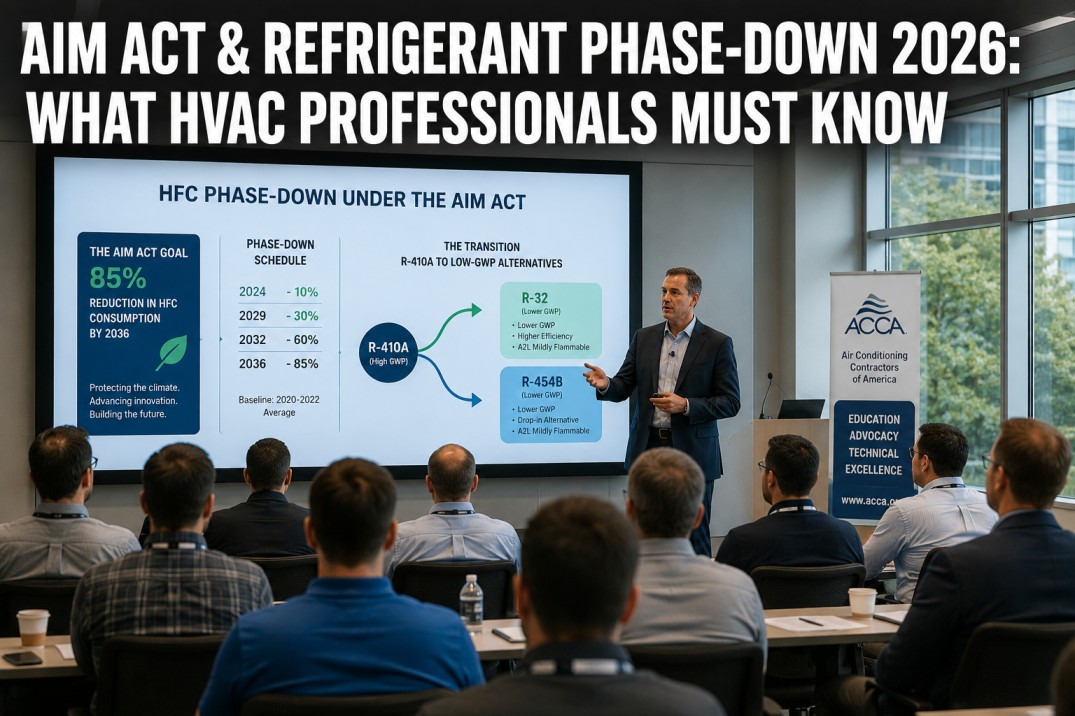
What are the primary drivers of HVAC market growth in 2026?
The HVAC market in 2026 is driven by four primary growth forces that collectively contribute approximately $100 billion in incremental market value compared to 2024 baseline. Building electrification is the largest growth driver, contributing $28 billion in incremental market value through heat pump adoption across residential, commercial, and industrial applications, driven by federal and state-level policies including IRA tax credits covering up to 30 percent of heat pump costs for residential properties and commercial building performance standards in 15 states that require 20 to 40 percent energy reductions by 2030, forcing building owners to replace gas heating equipment with electric heat pumps. Regulatory compliance is the second-largest driver at $22 billion incremental, driven by the AIM Act HFC phasedown requiring 40 percent reduction in R-410A consumption by 2028 and 85 percent by 2036, forcing replacement of 45 million tons of installed refrigeration and AC capacity in the United States alone, with similar dynamics under the EU F-Gas regulation and Kigali Amendment signatory countries. Construction and infrastructure investment contributes $32 billion in incremental market value, with US commercial construction spending at $1.2 trillion in 2026 driven by infrastructure bill funding, semiconductor and battery factory construction, and healthcare facility expansion, while global urbanization adds 1.2 million square feet of new building space daily primarily in Asia-Pacific markets. Smart technology adoption contributes $18 billion incremental at 11.2 percent CAGR for controls and BAS, 14.5 percent CAGR for HVACaaS and energy services, as building owners invest in AI-powered analytics, IoT sensors, cloud-based building management platforms, and predictive maintenance systems that reduce energy consumption by 18 to 35 percent and equipment downtime by 40 to 60 percent. The technician workforce shortage and rising labor costs add further upward pressure on HVAC system pricing and service rates, with average HVAC equipment prices rising 4 to 7 percent annually and service labor rates increasing 8 to 12 percent year over year across most markets.
How is HVAC-as-a-Service changing the HVAC market structure?
HVAC-as-a-Service HVACaaS is fundamentally restructuring the HVAC market by shifting the industry from transactional equipment sales toward recurring subscription-based revenue models that align provider incentives with customer outcomes. The HVACaaS market segment reached $33 billion in 2026, growing at 14.5 percent CAGR and expanding from 7 percent of total HVAC market revenue in 2022 to 10 percent in 2026, with projections reaching 15 to 18 percent by 2030. Under the HVACaaS model, manufacturers and service providers retain ownership of HVAC equipment and charge building owners a monthly fee covering equipment, installation, maintenance, repairs, and performance guarantees, converting capital expenditure of $180,000 to $350,000 for a typical 200-ton commercial system into operating expenditure of $8,000 to $15,000 per month under 10 to 15 year service agreements. This structural shift has three major implications for the HVAC market: it creates recurring revenue streams that increase company valuations with service-based HVAC companies trading at 4 to 6 times revenue versus 1.5 to 2.5 times for equipment-only manufacturers; it accelerates technology refresh cycles because service providers are financially motivated to install the most efficient equipment to minimize their energy cost exposure under performance guarantees, typically upgrading equipment at the midpoint of the contract term; and it transfers performance risk from building owners to service providers who guarantee minimum efficiency levels and maximum downtime, creating strong incentives for predictive maintenance and AI-powered optimization. Major manufacturers including Trane with Trane Rental Services, Carrier with Carrier Service Agreements, and Daikin with Daikin One Service are all scaling HVACaaS offerings, while pure-play HVACaaS companies such as Red Angel, North Star, and SkyCentrics are growing at 30 to 50 percent annually. The model works best for buildings with annual HVAC energy costs above $80,000 where efficiency improvements generate sufficient savings to cover the monthly fee, properties lacking capital budgets for equipment replacement, and portfolios pursuing ESG goals who benefit from guaranteed emissions reduction outcomes. Building owners considering HVACaaS should evaluate contract terms including annual fee escalation typically 2 to 3 percent, performance guarantee measurement and verification using IPMVP Option C or D protocols, and end-of-contract options including equipment purchase at fair market value, contract renewal at reduced rates reflecting depreciated equipment, or equipment removal and site restoration.
Leverage HVAC Market Intelligence for Smarter Equipment Investment
iFactory's platform provides HVAC market benchmarking, equipment cost tracking, regional comparison tools, technology adoption analytics, and investment planning models that help property managers align capital planning with industry trends. Book a demo to see how market intelligence drives smarter HVAC investment decisions and reduces total cost of ownership.