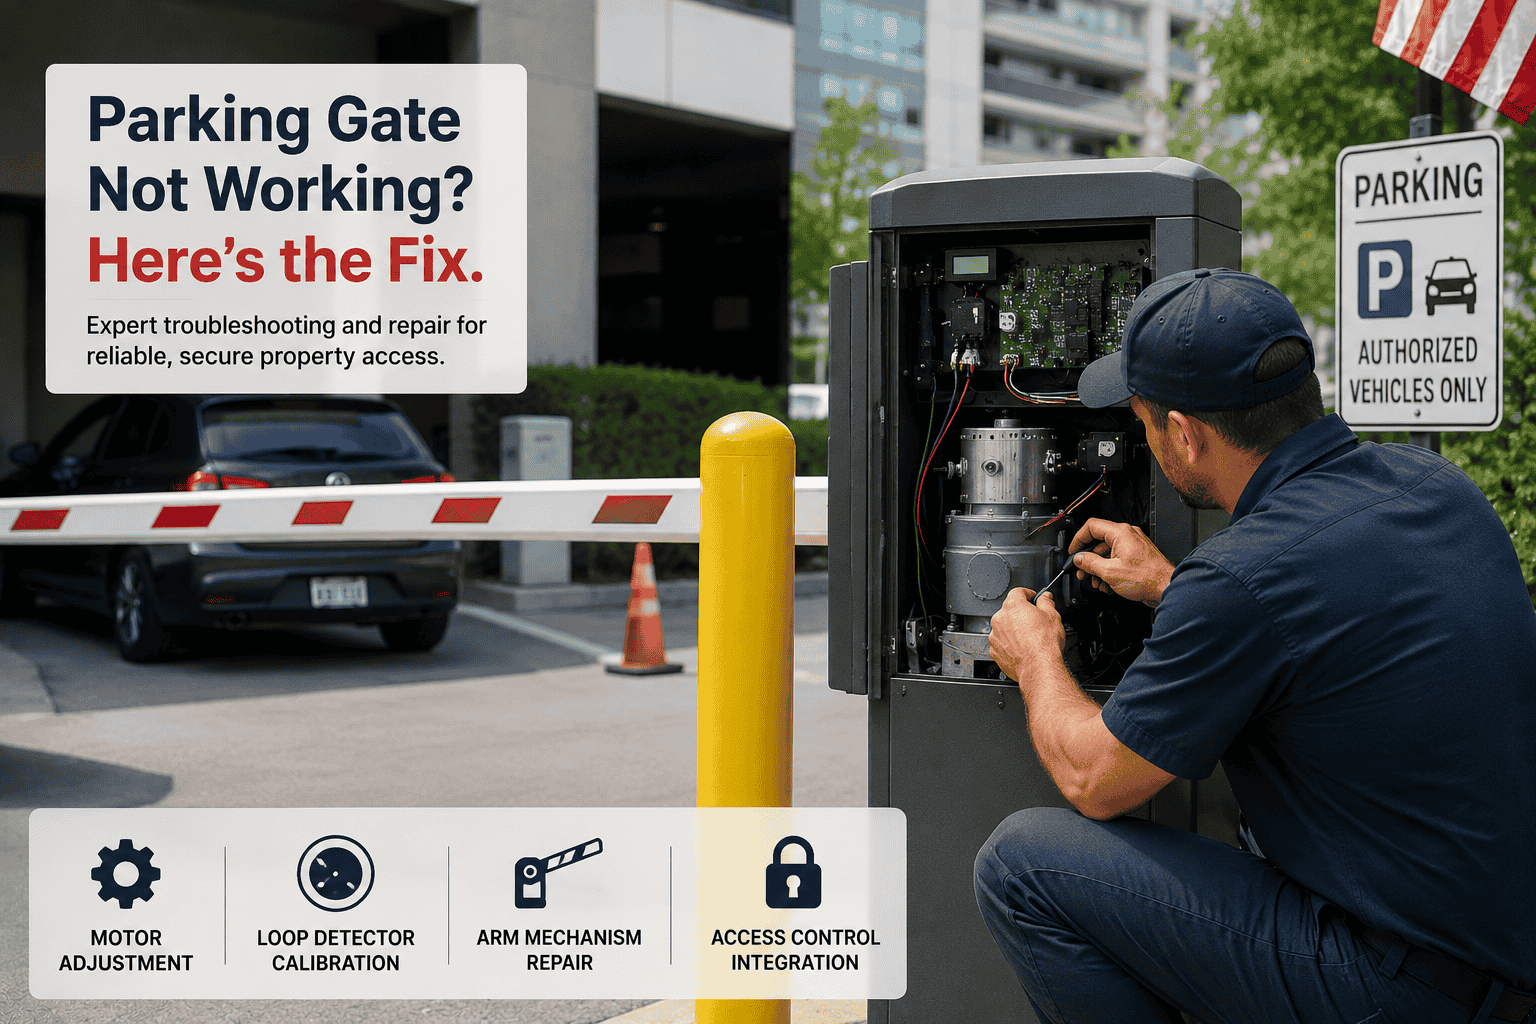
Every time a gate arm fails to lift, a barrier sensor misfires, or a loop detector stops responding — your parking revenue stops too. For commercial property managers and facility directors, parking gate and barrier systems are the first and last touchpoint of every visit. When they underperform, the ripple effect hits occupancy rates, tenant satisfaction, and operational costs simultaneously. This guide walks through the analytics, diagnostics, and intelligent monitoring strategies that keep automated parking access systems running at peak performance — and introduces how AI-driven oversight eliminates the guesswork entirely. Book a demo to see real-time gate health monitoring in action.
Why Parking Gate Systems Fail More Than You Think
Most facility teams only discover a gate problem after a tenant calls. That reactive cycle — complaint, dispatch, diagnosis, repair — typically costs 3–5x more than proactive detection. Commercial parking gates operate in high-frequency, high-stress conditions: hundreds of cycles per day, exposed to weather, vibration, and vehicle proximity events. The mechanical and electronic components that make up a modern barrier system are far more interdependent than they appear.
The 5 Most Common Parking Gate Faults — And Their Root Causes
Understanding failure modes is the foundation of effective analytics. Each fault type produces a distinct data signature that a monitoring system can identify before the physical failure becomes visible.
Loop Detector Desensitization
Induction loops embedded in the pavement degrade over time due to asphalt stress, temperature cycling, and moisture infiltration. The result is a detector that misses vehicles entirely or triggers phantom detections — causing arms to raise without a car present or fail to raise when one arrives.
Motor Torque Degradation
Gate arm motors lose torque gradually as brushes wear, lubricant thickens in cold weather, or drive belts stretch. The gate still moves — but slower than spec, creating dangerous stop-midway events and increased current draw that eventually trips breakers.
Arm Counterbalance Drift
Barrier arms rely on precise counterweight or spring tension to balance load on the motor. Physical impacts, temperature-driven material expansion, and spring fatigue shift this balance over weeks — placing sustained mechanical stress on gear assemblies.
Access Controller Communication Loss
Modern barriers integrate with license plate recognition (LPR), ticketing systems, and mobile access platforms via serial or IP protocols. Firmware mismatches, IP conflicts, and cable degradation silently break this link — leaving the physical gate operational but disconnected from revenue and access logic.
Safety Reversal Sensor Misalignment
Photocell or pressure-sensitive edge sensors that prevent the arm from closing on a vehicle require precise alignment to function. Vibration, cleaning, and minor impacts gradually shift sensor aim — creating either nuisance reversals (arm refuses to close) or dangerous failure-to-reverse events.
A Systematic Analytics Approach: From Symptom to Source
Effective gate analytics follows a layered diagnostic model — starting at the electrical foundation and moving through mechanical systems to software integration. This approach eliminates the "trial and error" dispatches that drive up maintenance budgets. Book a demo to explore how automated diagnostics maps to this framework in real time.
Layer 1 — Power & Electrical Baseline
Verify incoming voltage at the controller cabinet (typically 110V or 220V AC). Check transformer output, fuse condition, and ground continuity. Voltage sags below 5% of spec indicate a building power quality issue that will cause erratic gate behavior regardless of mechanical condition. Monitor current draw on motor circuits — a 15% increase over baseline indicates mechanical resistance before it becomes a failure.
Foundation check — complete before any mechanical inspectionLayer 2 — Loop Detector Calibration
Use a loop detector tester to measure oscillation frequency — the standard range is 20–135 kHz. Frequency drift beyond manufacturer tolerance requires re-tuning sensitivity. Check loop inductance using a loop inductance meter; a reading below 50 µH often indicates a broken loop wire. Map detection zones against physical vehicle positions to confirm full-coverage overlap at entry and exit points.
Critical for false-positive and missed-vehicle eliminationLayer 3 — Mechanical & Arm System Inspection
Measure open and close cycle times against manufacturer spec (typically 1–4 seconds depending on arm length). Inspect pivot points, gear boxes, and drive belts for wear indicators. Verify counterbalance — the arm should hold at 45° without motor power when properly balanced. Check limit switch positions and ensure they trigger within 2° of fully-open and fully-closed positions.
Documents baseline for predictive replacement schedulingLayer 4 — Access Control Integration Audit
Test end-to-end communication between the barrier controller and the access management platform. Confirm that every valid credential triggers a gate cycle with a logged timestamp on both systems. Identify any timestamp mismatches greater than 500ms — these indicate network latency issues that will affect LPR and payment reconciliation accuracy. Verify firmware compatibility across all integrated devices.
Revenue accuracy and compliance depend on this layerLayer 5 — Safety System Verification
Test photocell alignment using an alignment target at vehicle hood height (approximately 600–900mm). Confirm that breaking the beam within 50ms triggers a reversal command. For pressure-sensitive edges, apply controlled force across the full arm length and verify reversal activates within the required safety window. Log all safety test results for liability documentation.
Mandatory for liability compliance and insurance requirementsAI-Driven Gate Analytics Catches Faults Before Tenants Do
iFactory's monitoring platform continuously tracks cycle times, motor current, loop health, and integration signals — alerting your team to anomalies hours before a failure occurs.
Manual Troubleshooting vs. AI Analytics: A Direct Comparison
Understanding the performance gap between traditional maintenance approaches and AI-driven analytics helps facility managers build the case for platform investment.
| Capability | Manual / Reactive | AI Analytics Platform |
|---|---|---|
| Fault detection timing | After user complaint (hours–days) | Within 30 seconds of anomaly |
| Loop detector calibration | Manual quarterly inspection | Continuous frequency drift monitoring |
| Motor health tracking | Visual inspection only | Cycle time and amp-draw trending |
| Access control integration audit | Manual log comparison | Real-time transaction synchronization check |
| Maintenance dispatch accuracy | Blind dispatches, wrong parts | Root-cause identified before technician arrives |
| Safety compliance documentation | Manual logs, often incomplete | Automated safety event logging and reporting |
| Multi-site visibility | Property-by-property walkthroughs | Portfolio-wide dashboard, single view |
Predictive Maintenance Intervals: What Data Tells You
Analytics platforms convert raw gate telemetry into actionable maintenance schedules. Instead of calendar-based service intervals that waste resources on healthy equipment — or skip failing components — data-driven thresholds trigger service only when indicators reach defined risk levels.
Motor Drive Belt
Replace when cycle time increases 18% above baseline — typically 150,000–200,000 cycles. AI tracking pinpoints this threshold precisely rather than guessing at annual intervals.
Loop Detector Wire
Inductance monitoring flags degradation at 20% below installation baseline — typically 3–7 years in northern climates with freeze-thaw cycles causing asphalt stress.
Counterbalance Spring
Asymmetric raise/lower timing differentials greater than 400ms signal spring fatigue. Analytics catch this 4–8 weeks before the spring fails under load.
Photocell Emitter
Signal strength degradation below 70% of specification triggers an alignment or replacement alert — preventing the dangerous failure where the safety sensor stops protecting users.
Controller Board
Communication error rate increases and command latency spikes above 800ms indicate board capacitor degradation — a failure mode invisible to visual inspection but clear in telemetry data.
Limit Switch Contacts
Contact bounce events detectable in gate position logs indicate switch wear. Analytics flag more than 3 bounce events per 100 cycles as a replacement threshold.
Field Perspective: What Analytics Changes in Practice
Before we implemented platform-based gate analytics, our team was spending roughly 12 hours per week across properties just responding to gate calls. The pattern was always the same — tenant reports a problem, we dispatch, the tech discovers a loop detector issue or a motor that was clearly struggling for weeks. Once we connected our barrier systems to a centralized analytics platform, the entire pattern reversed. We started getting alerts about cycle time drift before any tenant noticed anything. The loop detector calibration recommendations alone reduced false-positive barrier raises by over 60% at our highest-traffic garage. The time savings translated directly to reassigning two maintenance staff to higher-value work. The data isn't complicated — it just needs to be collected and acted on systematically.
Connecting Gate Analytics to Your Broader Parking Ecosystem
Standalone gate health data is valuable. Gate data integrated with occupancy sensors, payment systems, and access control platforms is transformative. The diagnostic picture shifts from single-device troubleshooting to whole-system performance visibility. Book a demo to see how iFactory connects across your parking infrastructure.
License Plate Recognition (LPR)
Gate cycle data synchronized with LPR read timestamps confirms whether the system correctly authenticated a vehicle before raising the arm. Mismatches indicate either communication latency or a spoofing event requiring investigation.
Mobile & Ticketing Access
Cross-referencing ticket issuance with gate-open commands validates that revenue collection aligns with physical access. Revenue leakage — where gates open without a corresponding payment record — becomes immediately visible in integrated analytics.
Occupancy Sensor Network
Gate cycle counts compared against occupancy sensor data detect counting errors that lead to inaccurate "Lot Full" signals — a major driver of customer frustration and lost revenue at high-demand properties.
Building Management System (BMS)
Correlating gate electrical demand with BMS data isolates whether voltage irregularities originate from the gate system or from building-wide power quality events — preventing misdiagnosis and unnecessary gate repairs.
From Reactive Repairs to Predictive Precision
Parking gate and barrier systems are not passive infrastructure — they are high-cycle electromechanical devices that generate continuous diagnostic data. Facility teams that capture and act on that data eliminate the repair cycles that erode maintenance budgets and tenant confidence. The five fault categories covered here — loop detector drift, motor degradation, arm imbalance, access control communication loss, and safety sensor misalignment — each produce measurable early indicators. The question is whether your operation has the tools to see them.
AI-powered analytics platforms like iFactory move gate health management from a reactive labor cost into a predictive efficiency asset. Every dispatch becomes targeted. Every maintenance decision is data-backed. Every tenant interaction with a barrier system becomes a seamless, reliable experience. Book a demo to evaluate how predictive gate analytics fits your portfolio. Or book a demo with our engineering team to walk through your specific barrier infrastructure.
Frequently Asked Questions: Parking Gate Analytics
What data does an analytics platform collect from a parking gate?
A monitoring platform ingests cycle timing data (open/close duration), motor current draw, loop detector signal quality, limit switch events, access controller communication logs, and safety reversal event records. This data stream is analyzed continuously to identify deviations from each gate's individual performance baseline.
Can analytics work with gates we already have installed?
Yes — modern monitoring platforms use hardware-agnostic gateway devices that connect to existing gate controllers via serial, relay, or network interfaces. Compatibility spans all major commercial barrier brands. A brief integration assessment confirms the appropriate connection method for each installed unit.
How quickly does predictive analytics actually detect a developing fault?
Detection timing depends on fault type. Motor torque degradation and loop inductance drift are typically detectable 2–6 weeks before a functional failure. Controller communication errors can generate alerts within seconds of occurrence. Safety sensor misalignment events are flagged within the same operating cycle.
Does gate analytics require significant infrastructure changes?
No major infrastructure changes are required. Monitoring gateways are installed at the controller cabinet level and connect to existing wiring and network infrastructure. For facilities with poor connectivity, cellular-based backhaul options eliminate the need for Ethernet runs to each barrier installation.
How does this support multi-site facility management?
A centralized analytics dashboard provides portfolio-wide visibility across all barrier installations simultaneously. Property managers see health status, active alerts, and performance trends for every gate at every location from a single interface — eliminating the property-by-property inspection rounds that consume maintenance team hours.
See Every Gate's Health Status — Right Now
iFactory's AI monitoring platform connects to your existing parking barrier systems and delivers real-time fault detection, predictive maintenance alerts, and integrated access control analytics across your entire property portfolio.