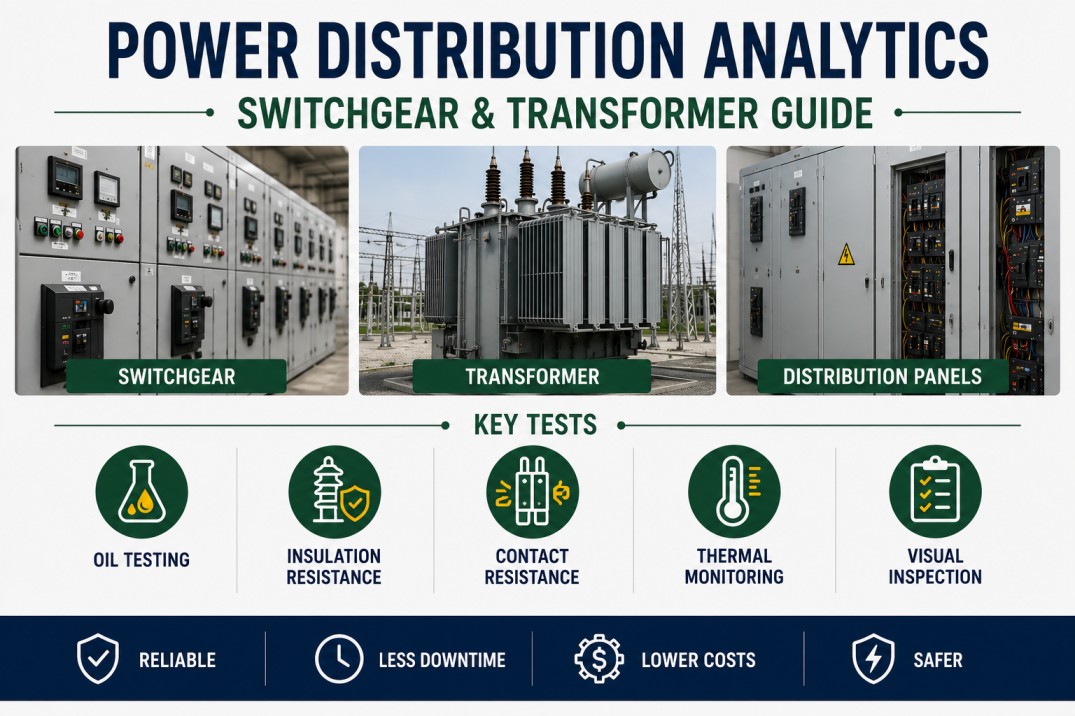
Power distribution equipment operates silently behind closed doors — until a switchgear fault or transformer failure stops your building cold. A single medium-voltage transformer failure costs $150,000 to $2 million in equipment, downtime, and emergency labor. Yet 70% of transformer faults are preceded by measurable indicators that analytics would have caught. iFactory Facility Intelligence brings switchgear and transformer monitoring into your preventive maintenance program — with oil testing schedules, partial discharge tracking, thermal imaging workflows, and fleet-wide health dashboards built for commercial portfolios. Book a demo to see how structured power distribution analytics protects your critical electrical infrastructure.
Monitor Every Switchgear and Transformer Across Your Portfolio
Stop discovering power distribution problems through outages and emergency calls. Combine scheduled oil testing, partial discharge surveys, thermography scans, and health scoring into one platform built for commercial facility teams.
Power Distribution Failures Are Expensive, Predictable, and Preventable
Switchgear and transformers are the most expensive assets in your electrical distribution system and the most critical to building operations. A single failure triggers cascading costs: emergency replacement, crane rental, overtime labor, tenant compensation, and business interruption that far exceeds the equipment itself. The Insurance Institute for Business and Home Safety reports that electrical distribution failures account for 25% of all commercial property insurance claims — and the majority were preceded by detectable warning signs that routine analytics would have identified weeks or months before the event.
Switchgear vs. Transformers: Different Assets, Same Monitoring Discipline
Switchgear distributes power; transformers step voltage up or down. Both fail differently and require distinct analytics — but a unified program treats them as one critical infrastructure layer. Understanding the difference shapes the inspection schedule, the test methods, and the replacement planning for each.
| Attribute | Switchgear | Transformers |
|---|---|---|
| Primary function | Distribution and circuit protection | Voltage step-up or step-down |
| Typical service life | 20-30 years | 25-40 years |
| Top failure cause | Contactor/breaker wear, loose connections | Insulation degradation, oil contamination |
| Primary analytics method | Thermography, contact resistance test | Oil analysis, dissolved gas analysis |
| Secondary analytics | Partial discharge, insulation resistance | Partial discharge, power factor test |
| Inspection frequency | Semi-annual thermography | Annual oil sampling + thermography |
| Critical failure cost | $50K-$500K | $150K-$2M+ |
| Failure timeline | Weeks to months (progressive) | Months to years (gradual) |
Four Analytics Layers That Protect Your Power Distribution Equipment
A complete power distribution analytics program operates across four diagnostic layers — each catching what the others miss. Together they provide overlapping coverage that detects developing faults at every stage, from early degradation to imminent failure.
Thermal Imaging
Infrared thermography of all terminations, connections, and breaker faces. Delta-T measurements identify loose connections, overloaded circuits, and failing components before they escalate. Baseline images establish normal thermal patterns for comparison.
Oil Analysis & Dissolved Gas Analysis
Annual sampling of transformer insulating oil. DGA detects arcing, partial discharge, and thermal faults through gas signature analysis. Moisture content, dielectric strength, and acidity measurements track insulation health over time.
Partial Discharge Testing
Ultrasonic and transient earth voltage detection of partial discharge activity in switchgear and transformer windings. PD is the earliest warning of insulation breakdown — catching it months before it becomes a phase-to-ground fault.
Insulation & Contact Resistance
Megger (insulation resistance) testing of windings and cables. Ductor (contact resistance) testing of breaker contacts and bolted connections. Trending resistance values over time reveals deterioration before it reaches critical thresholds.
Turn Power Distribution Data Into a Capital Protection Plan
Our team maps your switchgear and transformer inventory, configures analytics schedules, and builds health-score dashboards in iFactory — so your technicians know exactly what to test, when to test it, and what the results mean for your replacement planning.
Six Failure Modes That Power Distribution Analytics Catches
Field experience and IEEE studies consistently show that the majority of switchgear and transformer failures fall into six predictable patterns. Each pattern has a distinct thermal, electrical, or chemical signature that analytics detects — often months before the failure event.
Loose Connections & High Resistance
Loose terminations at breakers, bus bars, and lugs generate resistive heating. Delta-T values above 10°C warrant immediate corrective action. The most common thermographic finding in switchgear inspections.
Insulation Breakdown
Aging paper insulation and oil degradation reduce dielectric strength. Partial discharge activity accelerates as insulation weakens. DGA detects the gases produced before the failure becomes catastrophic.
Overloading & Thermal Stress
Sustained operation above nameplate rating accelerates insulation aging by the Arrhenius equation — every 10°C above rated temperature halves insulation life. Analytics flags overloading through thermal and load data correlation.
Contactor & Breaker Wear
Pitted or eroded contacts increase resistance and generate heat. Contact resistance testing (ductor) measures micro-ohm values across each pole. Rising trends indicate contact degradation before failure.
Oil Contamination & Moisture
Water ingress, particulate contamination, and oxidation degrade transformer oil dielectric strength. Moisture content above 20 ppm in medium-voltage transformers significantly increases failure risk.
Partial Discharge Activity
Corona, surface tracking, and void discharge in insulation systems. PD is the earliest detectable warning of insulation failure. Ultrasonic and TEV sensors catch activity months before breakdown.
The Maintenance Priority Framework for Power Distribution Assets
When analytics identifies an anomaly, the response depends on severity, criticality, and equipment condition. The framework below aligns with IEEE and NFPA 70B recommendations for prioritizing corrective actions based on quantitative measurements.
Frequently Asked Questions
How often should switchgear be thermally inspected?
NFPA 70B recommends annual infrared surveys for most switchgear, with semi-annual inspections for critical equipment, aging installations (20+ years), and systems in harsh environments. High-load or mission-critical switchgear in data centers or hospitals benefits from quarterly thermography to catch developing hot spots before they coincide with peak demand periods.
What is dissolved gas analysis and why does it matter for transformers?
DGA measures the concentration of gases dissolved in transformer insulating oil — hydrogen, methane, acetylene, ethylene, ethane, carbon monoxide, and carbon dioxide. Different gas ratios indicate different fault types: arcing produces high acetylene, partial discharge produces high hydrogen, thermal faults produce high ethylene. Trending DGA results over time detects developing faults months before oil breakdown or winding failure occurs.
What is the difference between partial discharge and insulation resistance testing?
Insulation resistance testing (megger) applies a DC voltage and measures leakage current through the insulation — it provides a bulk assessment of insulation condition at a single point in time. Partial discharge testing detects localized electrical activity within insulation voids, cracks, or contamination — it identifies specific areas of degradation that IR testing may not reveal. Both are complementary: IR tells you if insulation is degraded, PD tells you where and how badly.
When should a transformer be replaced instead of repaired?
Key replacement indicators include: insulation resistance below 100 megohms, DGA showing high-energy arcing (acetylene above 50 ppm), moisture content above 30 ppm, age exceeding 30 years with significant load history, and a failure history of more than two significant repairs. The economics also matter — if repair cost exceeds 60% of replacement cost and the transformer is over 20 years old, replacement is almost always the better long-term decision.
How does iFactory help manage power distribution analytics across multiple buildings?
Each switchgear and transformer is registered as an asset with manufacturer, model, voltage rating, age, and service history. Analytics schedules — thermography, oil sampling, PD testing, contact resistance — are configured as recurring work orders with pass-fail thresholds. Technicians document test results, thermal images, and DGA reports on mobile devices at the equipment. Facility managers see fleet-wide health scores, trending data, and replacement planning in one dashboard — with automatic alerts when any measurement exceeds established thresholds.
Protect Your Power Distribution Infrastructure With Structured Analytics
Stop discovering switchgear and transformer problems through outages and equipment failures. Combine scheduled oil testing, thermography surveys, partial discharge tracking, and health score dashboards into one platform built for commercial facility portfolios.