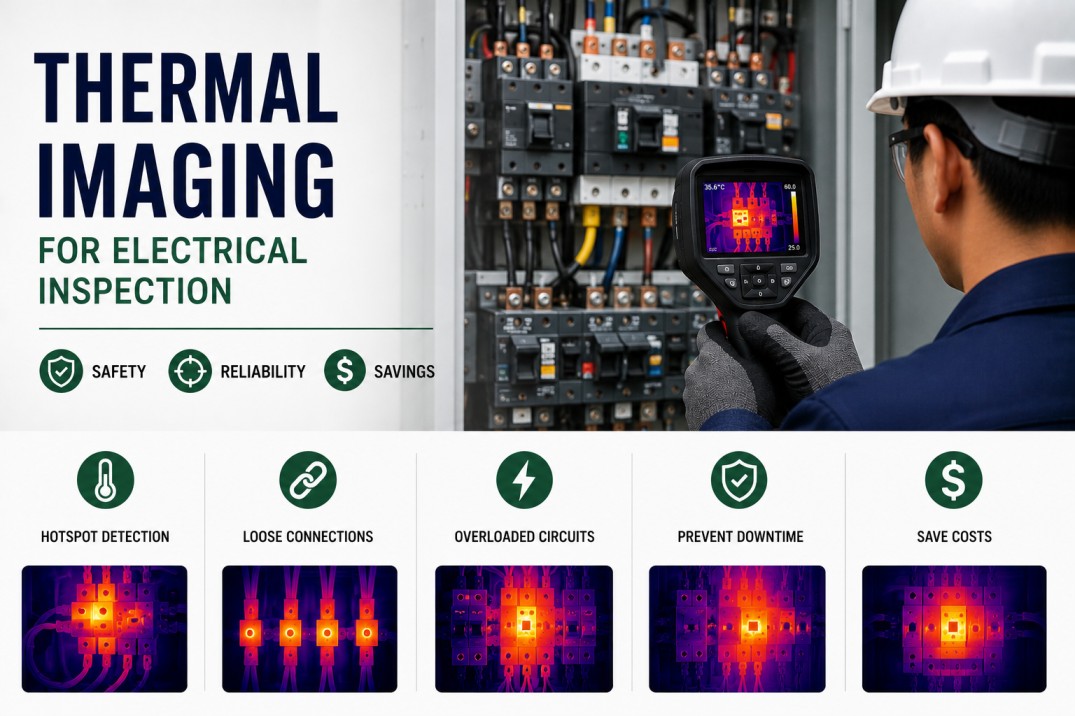
Electrical system failures are the leading cause of commercial building fires, yet most electrical faults generate detectable heat for weeks or months before catastrophic failure. A single electrical fire costs $35,000+ in property damage alone — yet thermographic surveys catch 90% of developing faults before they escalate. iFactory Facility Intelligence integrates thermal imaging workflows into your electrical PM program, tracking inspection schedules, hotspot remediation, and compliance across every panel and distribution point in your portfolio. Book a demo to see how structured thermography protects your buildings and your bottom line.
The Complete Thermal Imaging Electrical Inspection Guide
A practical playbook for using infrared thermography to detect electrical hot spots, loose connections, overloaded circuits, and failing components — built for facility managers running commercial building portfolios.
Why Electrical Systems Fail Without Warning — And What Thermography Reveals
Electrical distribution equipment operates behind closed panels, often in basements, mechanical rooms, or rooftops. By the time a breaker trips, a wire melts, or a fire starts, the fault has been developing for weeks. Thermal imaging sees what visual inspections cannot: the temperature signature of resistance, imbalance, and impending failure.
- ▲Faults found only during failure or fire
- ▲Emergency repairs at premium rates
- ▲Operations downtime measured in days
- ▲Insurance premiums rise after claims
- ▼Hot spots identified during scheduled PM
- ▼Planned repairs during business hours
- ▼Zero unplanned electrical downtime
- ▼NFPA 70B compliance documented
A Complete Electrical Thermography Program, Built Around NFPA 70B
NFPA 70B recommends annual infrared surveys of electrical distribution equipment, with more frequent inspections for aging systems, high-load environments, and critical operations. A structured program follows a repeatable cycle: scan, document, prioritize, remediate, re-inspect.
Map Your Electrical Distribution System
Document every panel, disconnect, transformer, breaker, and busway in your portfolio. Tag them by location, criticality, load profile, and age. This asset register drives inspection frequency and priority.
Perform Baseline and Periodic Thermography
Thermal imaging under at least 40% of rated load. Capture all connection points, breaker terminations, bus bar joints, and transformer windings. Baseline images establish normal thermal patterns for each asset.
Classify Findings by Temperature Rise
Use standardized severity levels (NFPA 70B or InterNational Electrical Testing Association) to categorize each anomaly by temperature rise above ambient or matched components. Priority determines response window.
Tighten, Replace, or De-rate and Re-scan
Tighten loose connections to manufacturer torque specs. Replace damaged breakers, bus bars, or conductors. Clean contaminated surfaces. Re-scan after corrective work to verify the thermal anomaly is resolved.
Track Every Electrical Hotspot Across Your Full Portfolio
Our team maps your electrical distribution equipment, configures thermography inspection schedules, and builds severity-based remediation workflows in iFactory — so your technicians know exactly what to scan, where to look, and when to act.
What Thermal Imaging Finds in Commercial Electrical Systems
Field experience and NFPA data consistently show that the vast majority of electrical anomalies detectable by thermography fall into seven predictable categories. Recognizing the pattern shapes both the inspection protocol and the urgency of response.
Loose Connections
The most common electrical hot spot. Loose terminations in breakers, lugs, or bus bars generate resistive heating. Delta-T can exceed 50°C above ambient. Leading cause of electrical panel fires.
Overloaded Circuits
Conductors or breakers operating above rated ampacity generate uniform heating along the circuit. Often indicates unbalanced loads, undersized feeders, or added equipment that exceeds original design.
Phase Imbalance
Uneven heating across the three phases of a motor, transformer, or feeder. Typically 10-30% temperature variation. Indicates voltage imbalance, harmonic distortion, or single-phase loading issues.
Failed or Failing Breakers
Internal resistance in a circuit breaker generates heat on the breaker face. Delta-T across poles of the same breaker exceeding 5°C signals internal degradation. Trip mechanism may be compromised.
Transformer Overheating
Dry-type transformers running hot indicate harmonics, overloading, or failing windings. Winding temperature more than 10°C above nameplate rating accelerates insulation degradation and reduces service life.
Deteriorated Insulation
Aging or damaged insulation allows leakage current, producing localized heating. Common in older conductors, wet environments, and areas with chemical exposure. Precursor to phase-to-phase or ground faults.
Contaminated or Corroded Connections
Moisture, dust, or corrosion at connection points increases electrical resistance. Common in outdoor disconnects, bus ducts, and panelboards in humid environments. Often visible as diffuse thermal patterns.
The Severity Framework Every Facility Manager Needs
When a thermographic survey finds anomalies, the question isn't whether to act — it's how urgently. The framework below aligns with NFPA 70B recommendations and industry best practices for prioritizing electrical hot spots based on temperature rise and risk exposure.
Frequently Asked Questions
How often should thermal imaging be performed on electrical systems?
NFPA 70B recommends annual infrared surveys for most commercial electrical distribution equipment. Higher frequencies — semi-annual or quarterly — are appropriate for aging systems (20+ years), high-load environments (data centers, manufacturing), critical operations (hospitals, emergency systems), and systems with a history of thermal anomalies.
What equipment should be included in an electrical thermography program?
All energized electrical distribution equipment: switchgear, panelboards, distribution boards, motor control centers, disconnect switches, busways, transformers, breakers (main and branch), contactors, relays, fuses, terminations, and connections. Every point where current flows through a junction or device generates heat; every junction is a potential inspection target.
What conditions are needed for a reliable thermal scan?
The system must be under load — ideally 40% or more of rated capacity — to generate measurable heat at faulted connections. Emissivity settings must be calibrated for the target surface (painted metal, bare copper, etc.). Reflected temperature should be accounted for. Scans should avoid direct sunlight on outdoor equipment. Thermal imagers should be calibrated annually.
What is the most common thermal anomaly found in commercial electrical panels?
Loose connections account for roughly 60% of all thermal anomalies found in commercial electrical systems. They occur most frequently at breaker terminations, lug connections, and bus bar joints. The characteristic signature is a localized hot spot at a single termination, with surrounding components at normal temperature.
How does iFactory help manage electrical thermography across multiple buildings?
Each electrical asset is registered with location, criticality, load profile, and inspection history. Thermography surveys are scheduled as recurring work orders with severity-based priority. Technicians document thermal images, temperature readings, and ambient conditions on mobile devices at the panel. Facility managers see fleet-wide hotspot tracking, repair verification, and compliance reporting in one dashboard.
Turn Thermal Data Into Electrical Safety Across Every Building
Stop discovering electrical hazards through failures, fires, and emergency calls. Combine scheduled thermography surveys, severity-based remediation workflows, and compliance tracking into one platform built for commercial facility portfolios.