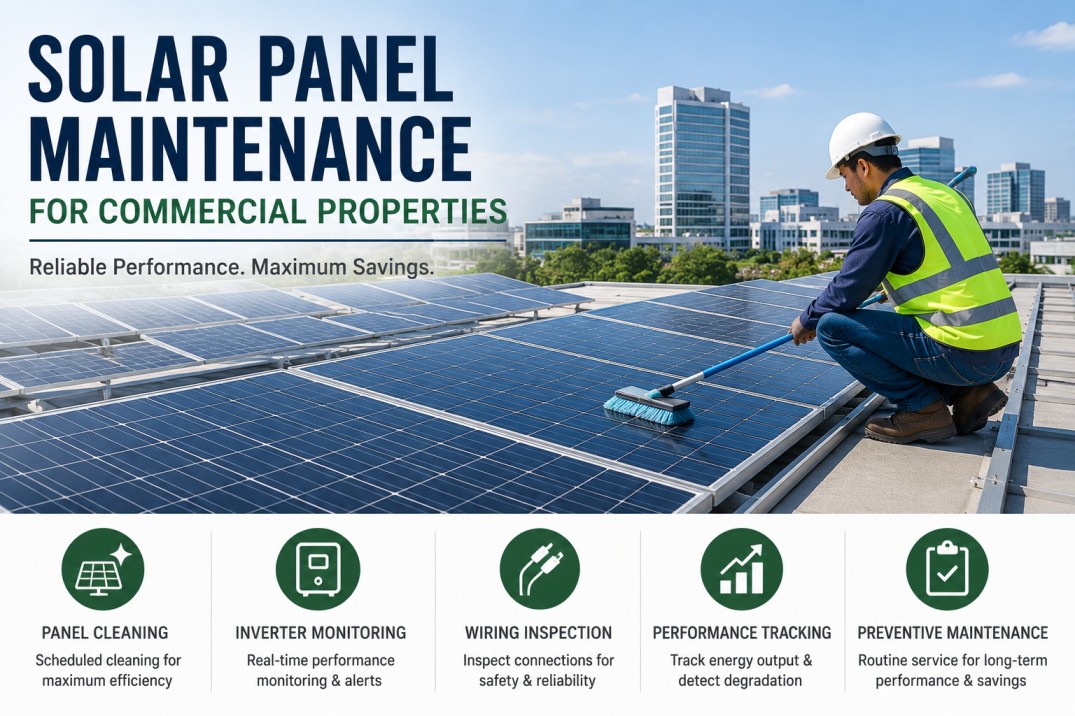
Commercial rooftop solar is one of the highest-value assets on your property — and one of the most under-monitored. Without structured analytics, performance degradation goes undetected, inverter faults compound silently, and your ROI shrinks quarter after quarter.
Solar Analytics · Commercial
Is Your Rooftop Solar
Actually Performing?
Actually Performing?
A data-driven analytics framework for commercial property managers and energy teams
Know Before You Lose Output
iFactory connects your solar assets to a single analytics dashboard — cleaning schedules, inverter alerts, and performance trends in one place.
The Hidden Cost
What Poor Solar Analytics Actually Costs You
78%
of commercial solar underperformance goes undetected for 6+ months without monitoring
0.5–1%
annual efficiency loss per panel from soiling alone — compounding every quarter
$18K
average annual revenue loss per 100kW system from undetected degradation and faults
3.2×
higher fault detection rate for properties using automated monitoring vs. manual inspection
Analytics Framework
The 4 Pillars of Commercial Solar Analytics
Effective solar analytics is not just about checking kWh output. It requires four interconnected data streams — each catching failure modes the others miss.
01
Performance Monitoring
Track actual kWh output vs. expected yield using irradiance-adjusted models. Identify string-level underperformance and isolate underperforming modules before they affect whole-system output.
Key Metric: Performance Ratio (PR) — Target > 80%
02
Inverter Health Tracking
Monitor inverter efficiency, temperature trends, fault codes, and MPPT performance in real time. Inverter failures account for over 40% of system downtime — catching early anomalies prevents costly shutdowns.
Key Metric: Inverter Efficiency — Target > 96%
03
Soiling & Cleaning Analytics
Use output-vs-weather correlation to calculate soiling loss. Generate data-driven cleaning schedules based on actual performance impact, not fixed calendar dates. On average, cleaning recovers 3–7% output.
Key Metric: Soiling Loss Ratio — Target < 2%
04
Degradation Trend Analysis
Benchmark annual capacity degradation against manufacturer specifications (typical 0.5–0.7%/year). Identify accelerated degradation clusters, predict output 5 years forward, and build replacement planning budgets.
Key Metric: Annual Degradation Rate — Target < 0.7%/yr
Monitoring KPIs
Solar Analytics KPI Reference for Property Managers
These are the metrics your analytics platform should surface — and the thresholds that should trigger action.
| KPI | Definition | Target Range | Alert Threshold | Action Required |
|---|---|---|---|---|
| Performance Ratio (PR) | Actual vs. expected output adjusted for irradiance | 0.75–0.85 | < 0.70 | String-level fault investigation |
| Specific Yield | kWh produced per kWp installed | 1,200–1,600 kWh/kWp | < 1,100 kWh/kWp | Inverter and shading audit |
| Soiling Loss Ratio | Output loss attributed to panel soiling | < 2% | > 4% | Schedule immediate panel cleaning |
| Inverter Efficiency | DC-to-AC conversion efficiency | > 96% | < 94% | Firmware check, thermal inspection |
| System Availability | % of hours system is operational | > 99% | < 97% | Inverter or grid connection fault review |
| Annual Degradation Rate | Year-over-year output decline per panel | 0.5–0.7%/yr | > 1.0%/yr | Thermal imaging, module replacement plan |
| Clipping Loss | Energy lost due to inverter saturation | < 1% | > 3% | Inverter sizing review |
All 7 KPIs. One Dashboard.
iFactory automates solar performance tracking, generates cleaning work orders based on soiling thresholds, and flags inverter anomalies before they cost you output.
Data-Driven Cleaning
Cleaning Schedule: Calendar vs. Analytics-Driven
Fixed cleaning intervals waste budget in low-soiling periods and miss critical windows in high-particulate environments. Analytics-driven scheduling closes that gap.
Calendar-Based Cleaning
Fixed quarterly or biannual schedule regardless of actual soiling
No correlation with weather events or dust accumulation data
Cleaning sometimes done when panels are already performing well
High soiling events (wildfires, storms) missed between schedules
Budget spent on unnecessary cleaning cycles
Avg. excess cleaning cost: +$2,400/100kW/yr
Analytics-Driven Cleaning
Cleaning triggered when soiling loss exceeds defined threshold (e.g., >3%)
Weather and particulate data integrated for predictive scheduling
Work orders auto-generated and dispatched through CMMS
Post-cleaning output verified against pre-cleaning baseline
Full cost-per-clean vs. output-recovered ROI tracking
Avg. output recovery: +4.8% per cleaning event
Inspection Protocol
Annual Solar Inspection Workflow
1
Pre-Inspection Data Pull
Extract 12-month performance data. Calculate actual vs. modeled output by string, inverter, and zone. Flag any strings showing >10% deviation from baseline for targeted thermal inspection.
2
Thermal Imaging Survey
Conduct drone or handheld IR camera scan of all panels during peak irradiance (10am–2pm). Document hotspots, bypass diode failures, and delamination. Correlate thermal anomalies with string performance data.
3
Wiring & Connection Inspection
Inspect MC4 connectors, conduit penetrations, combiner box terminals, and grounding continuity. Check for UV degradation on cable insulation, water ingress in junction boxes, and loose terminations.
4
Inverter Diagnostic
Review inverter error log history, fan operation, capacitor health, and MPPT tracking accuracy. Benchmark efficiency against nameplate specification. Test grid protection relay settings and AC disconnect function.
5
Structural & Mounting Review
Inspect racking torque, flashing integrity, and roof membrane condition at all penetrations. Verify compliance with local wind and snow load requirements. Check for panel micro-cracks with EL imaging if warranted.
6
Report, Close & Schedule
Log all findings in asset management system with photo documentation. Issue corrective work orders with priority ratings. Update performance model with current degradation data. Set next inspection and KPI review dates.
FAQ
Solar Analytics: Common Questions
How often should commercial solar panels be inspected?
A full inspection should be conducted annually, supplemented by continuous remote monitoring. Properties in high-soiling environments (near highways, construction zones, or in wildfire-prone regions) benefit from bi-annual physical inspections. Inverter health data should be reviewed monthly at minimum.
What is a good Performance Ratio for a commercial solar system?
A well-maintained commercial system should maintain a Performance Ratio (PR) between 0.75 and 0.85. New systems often achieve 0.80–0.85 in the first year. A PR below 0.70 warrants immediate investigation — typical causes include soiling, shading changes, inverter inefficiency, or string-level faults.
Can analytics detect individual panel failures in a large array?
Yes — with string-level or module-level monitoring (using microinverters or DC optimizers). String-level monitoring identifies which string contains the underperforming module; module-level monitoring pinpoints the exact panel. For standard string inverter systems, combining performance data with thermal imaging achieves the same resolution.
How does a CMMS improve solar analytics outcomes?
A CMMS connects performance data to actionable maintenance workflows. When a KPI threshold is breached — soiling loss exceeding 3%, or a PR drop below 0.72 — the CMMS automatically generates a work order, assigns it to the right technician, and tracks resolution. This closes the loop between monitoring data and physical maintenance action, which is where most standalone monitoring platforms fall short.
What data is needed to track solar panel degradation accurately?
Accurate degradation tracking requires at minimum: monthly kWh output records, on-site or nearby irradiance data (pyranometer or satellite-based), ambient temperature logs, and installation date with original commissioning output baseline. With three or more years of clean data, linear regression models can reliably project 10-year output trajectories for warranty and financial planning purposes.
Your Solar Data Exists.
Now Put It to Work.
Now Put It to Work.
iFactory centralizes your solar analytics, cleaning history, inspection records, and inverter alerts — so your team acts on data, not assumptions. Trusted by commercial property teams across the US.