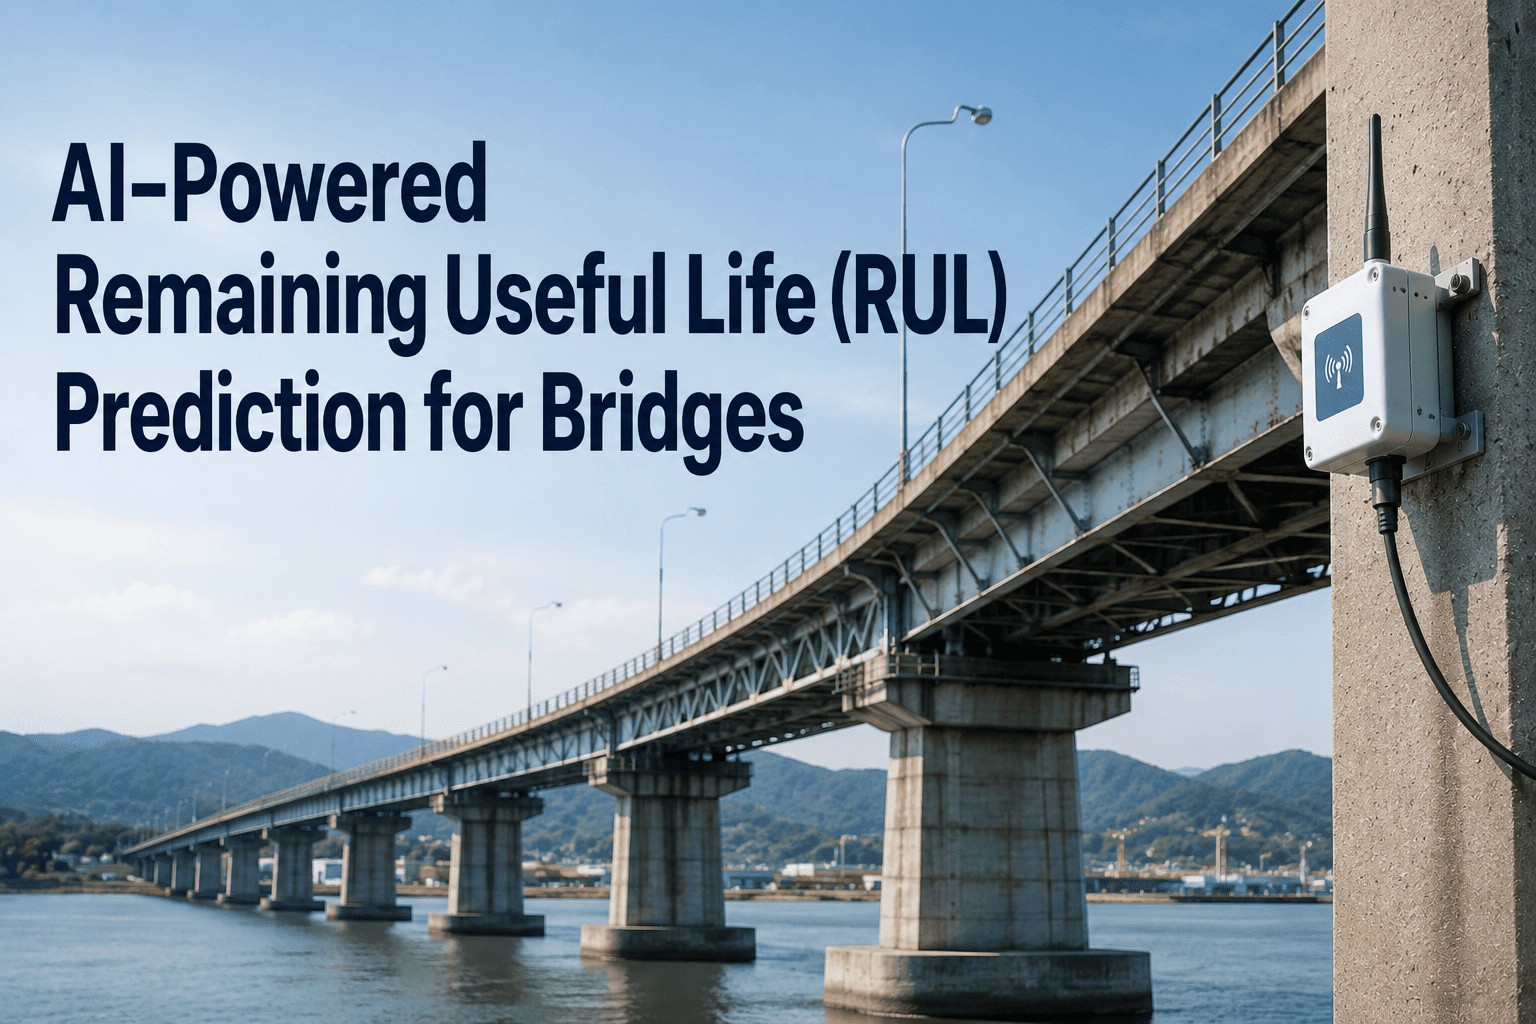
A bridge does not fail overnight. It accumulates micro-cracks, corrodes in tidal cycles, fatigues under traffic, and loses prestress over decades — and traditional biennial inspections capture only snapshots of that long degradation arc. AI-powered Remaining Useful Life (RUL) prediction changes the picture entirely. By fusing acoustic emission data, strain gauges, accelerometers, visual inspection imagery, and historical inspection records, modern ML models construct a continuous Health Indicator for each structural element and forecast how many months or years remain before intervention is required. Published research shows LSTM-based fatigue models reduce mean-squared error by over 60% versus classical backpropagation networks, and CNN-LSTM hybrids reach single-digit mean-absolute-percentage error on corrosion forecasting. This article walks through how AI-based RUL prediction actually works on bridge assets — the data, the models, the accuracy benchmarks, and the structural elements most ready for it. Book a Demo to see iFactory's bridge RUL pipeline deployed on highway and rail infrastructure today.
Technical Article · Bridge RUL Prediction
Predicting Bridge Remaining Useful Life — Continuously, Not Biennially.
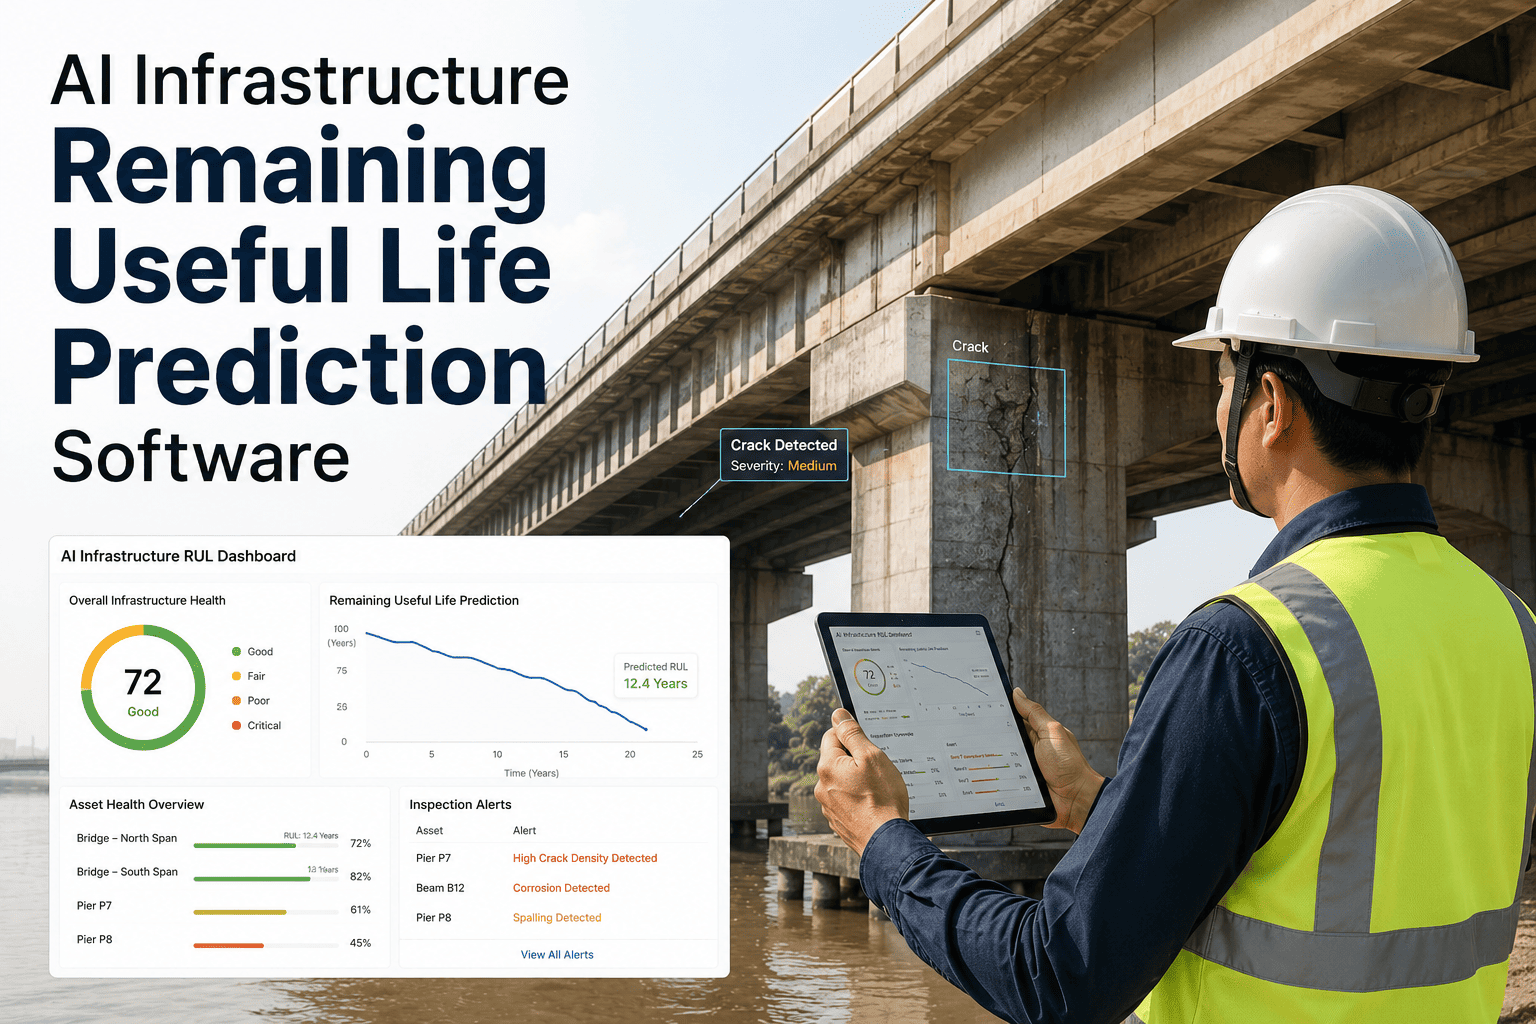
iFactory's RUL pipeline fuses sensors, inspection records, and ML models to produce a live health indicator for every monitored bridge element — so maintenance is planned by data, not by calendar.
61%
MSE reduction by LSTM vs classical BP networks on bridge fatigue prediction
4-9%
MAPE achieved by CNN and LSTM on corrosion rate prediction
35%
RMSE reduction in LSTM-based side-mode suppression ratio forecasting
29 factors
Identified by Taiwan Bridge Management System for deck deterioration modelling
The Bridge RUL Lifecycle Arc
Every monitored bridge moves through five stages. AI RUL prediction shifts the intervention decision from Stage 4 (visible distress) back to Stage 2 (early degradation) — where repairs cost a fraction of emergency rehabilitation.
Stage 01
Healthy Baseline
Years 0–10
Stage 02
Early Degradation
Years 10–30
Stage 03
Active Deterioration
Years 25–50
Stage 04
Visible Distress
Years 40–70
Stage 05
End of Service Life
Years 60+
Conventional inspections catch problems at Stage 4. AI RUL prediction catches them at Stage 2 — when intervention cost is typically 5–10x lower.
How the AI RUL Pipeline Actually Works on a Bridge
A production-grade bridge RUL pipeline runs in four stages. Each stage uses the ML architecture best suited to its task.
01
Multi-Sensor Data Acquisition
Continuous ingestion of strain, vibration, tilt, temperature, acoustic emission, and inspection imagery — synchronised to a common time base and georeferenced to each structural element.
Inputs: strain gauges · accelerometers · AE sensors · cameras · FBG fibre optic
02
Health Indicator Construction
Deep neural networks (typically a stacked autoencoder) compress raw sensor streams into a single Health Indicator (HI) curve per element. Kullback-Leibler divergence between current and baseline signals quantifies deterioration in a model-ready format.
Models: stacked autoencoder · DNN · OC-SVM hit removal
03
RUL Forecasting
LSTM and CNN-LSTM hybrid networks consume the HI time-series and forecast how many months or years remain until the element crosses defined intervention thresholds. Quantile outputs give upper and lower confidence bounds for risk-aware planning.
Models: LSTM-RNN · CNN-LSTM hybrid · Transformer · Bayesian deep learning
04
Intervention Recommendation
RUL forecasts feed a prioritisation engine that ranks every element by failure probability × intervention cost, generates work orders into the CMMS, and updates the digital twin. Engineers review and approve before any field action.
Outputs: work order · maintenance window · CMMS sync · digital twin update
Bridge Element Readiness — Where AI RUL Prediction Works Best Today
Not every bridge element is equally ready for AI RUL prediction. This breakdown shows where the data, the models, and the deployment maturity intersect.
Production Ready
Bridge Decks & Concrete Beams
Mature acoustic emission + LSTM workflow. KLD-based health indicators reliably forecast deterioration months in advance.
Production Ready
Steel Girders & Trusses
CNN-based visual corrosion detection combined with strain-time-series LSTM gives reliable fatigue life forecasts.
Emerging
Cable Stays & Suspension Cables
FBG fibre-optic sensors with LSTM achieve 35% RMSE reduction on side-mode suppression ratio — strong but data-hungry.
Emerging
Bearings & Expansion Joints
Vibration and displacement sensor coverage is improving; transfer learning from rotating-equipment models is showing early promise.
Research Stage
Foundations & Pile Caps
Limited instrumentation access; AI RUL is constrained to inspection-derived condition ratings and PIML physics-informed approaches.
Research Stage
Abutments & Wing Walls
Photogrammetry and InSAR satellite monitoring feed early models, but ground-truth failure data remains sparse.
Accuracy Benchmarks — What Published Research Actually Reports
Cherry-picked accuracy claims dominate vendor marketing. These benchmarks are taken from peer-reviewed published studies on bridge and civil-infrastructure RUL.
Task
Best Model
Accuracy Metric
Reported Result
Concrete beam RUL via acoustic emission
SAE-DNN + LSTM-RNN
Health indicator quality
Outperforms baseline DNN
Bridge fatigue life via CFRP-FBG sensors
LSTM with PCA
MSE reduction vs BP NN
61.62% lower
Cable side-mode suppression ratio
LSTM
RMSE reduction
34.99% lower
Peak-to-valley ratio in cable monitoring
LSTM
MAE reduction
24.9% lower
Corrosion rate (primary circuit pipelines)
CNN
MAPE on test set
~4%
Corrosion rate (secondary circuit)
LSTM
MAPE on test set
~9%
Accuracy depends heavily on data volume, sensor quality, and element type. No single number generalises across all bridges — always validate on facility-specific data before operational use.
Five Real-World Challenges in Bridge RUL Deployment
01
Sparse failure data
Bridges rarely fail. Most training data captures normal aging, not catastrophic events. Synthetic augmentation and transfer learning are increasingly used.
02
Sensor environmental bias
Temperature, humidity, and traffic load create false readings if models do not separate environmental noise from genuine degradation signals.
03
Inspection-record inconsistency
Decades of inspection records use different rating scales, formats, and assessor judgments — needs normalisation before model training.
04
Explainability for regulators
Deep learning RUL forecasts must be defensible to bridge engineers and transport authorities. Bayesian DL and attention mechanisms help here.
05
Model drift across structures
A model trained on one bridge does not automatically work on another. Transfer learning and per-structure fine-tuning are required.
iFactory Bridge RUL Platform
From Biennial Inspection to Continuous Remaining-Life Prediction.
iFactory orchestrates the full RUL pipeline — sensor ingestion, health indicator construction, LSTM and CNN-LSTM forecasting, and CMMS work-order generation — on bridges across the UK, EU, and MENA infrastructure networks.
Trusted by highway authorities, rail operators, and bridge asset owners managing multi-billion-dollar portfolios.
Frequently Asked Questions
Tap any question to reveal the answer.
RUL is the predicted time remaining before a bridge element crosses a defined intervention threshold — not the time until the element collapses. For a concrete beam, that threshold might be a specific crack-width limit or stiffness loss percentage. For a steel girder, it could be a corrosion section-loss boundary. AI RUL models forecast when each element will reach its threshold, giving engineers a planning horizon — typically months to years — to schedule intervention before degradation accelerates.
A baseline RUL deployment uses strain gauges, accelerometers, and temperature sensors on critical girders and supports. Advanced deployments add acoustic emission (AE) sensors for concrete crack detection, FBG fibre-optic sensors for high-precision strain monitoring, tilt sensors on piers, and computer vision cameras for visual defect detection. The data needs scale with the model: simpler tree-based models work with sparse sensor coverage; LSTM and CNN-LSTM hybrids benefit from richer continuous streams. Book a demo to see sensor coverage planning.
Accuracy varies by element and data quality. Published research reports LSTM-based fatigue models achieving 61% lower MSE than classical backpropagation networks, CNN models reaching 4% MAPE on primary-circuit corrosion forecasting, and LSTM hybrids achieving 9% MAPE on secondary-circuit corrosion. Concrete beam RUL using stacked-autoencoder health indicators with LSTM-RNN forecasting consistently outperforms baseline DNN approaches. Always validate any vendor accuracy claim on your own facility data before going live.
No — but the prediction horizon scales with available history. Anomaly detection deploys with as little as 30–60 days of healthy operation data. Short-horizon RUL (weeks to months ahead) needs 6–12 months of historical sensor data. Long-horizon RUL (years ahead) benefits from 2–3 years of multivariate time series plus historical inspection records. Many deployments start with short-horizon prediction and extend the horizon as the model accumulates facility-specific data.
No — and regulators currently do not allow it to. FHWA and equivalent international regulators still mandate periodic visual inspections by certified engineers. AI RUL augments those inspections, not replaces them. It tells engineers which elements to focus on, which assets to inspect more frequently, and which interventions to schedule first. The combined approach — periodic mandated inspection + continuous AI RUL monitoring — produces better outcomes than either alone.
Environmental compensation is critical. A bridge expanding in summer heat and contracting in winter produces strain signals that look like deterioration if temperature is ignored. iFactory's pipeline ingests weather data, traffic counts, and seasonal cycles as model features so the AI separates environmental noise from genuine structural change. Bayesian deep learning approaches further help by producing confidence intervals that widen appropriately when conditions move outside the model's training range.
iFactory integrates with major bridge management systems including AASHTOWare BrM, Pontis, and national platforms like the Taiwan Bridge Management System via REST API. Asset registers flow in via standard formats, condition ratings sync bidirectionally, and AI-generated work orders feed straight into your existing CMMS workflow. There is no need to replace your bridge management system — iFactory adds the continuous RUL prediction layer on top of what you already have.