Data center facility maintenance operates under a performance standard that no other infrastructure sector matches — 99.999 percent uptime means no more than five minutes and 15 seconds of unplanned downtime per year, and every one of those minutes is measured, reported, and scrutinized by customers who chose your facility specifically because they were promised that number. The cooling system and power distribution infrastructure that sit behind that promise are extraordinarily complex interdependent systems where a single component failure — a stuck cooling valve, a degraded UPS battery, a failing generator fuel pump — can cascade through the facility in seconds if the monitoring and response systems are not designed to catch it first. Operations directors who still rely on standalone building management system alarms and periodic maintenance checklists are defending a five-nines commitment with tools built for three-nines environments, and the gap between those capability levels shows up in post-incident reports. AI-driven facility monitoring changes the equation by correlating data across cooling, power, and environmental systems simultaneously, detecting the subtle cross-system patterns that precede failures, and giving operations teams response time measured in minutes instead of seconds. To see how iFactory monitors your entire data center facility stack with cross-system AI correlation, book a 30-minute demo.
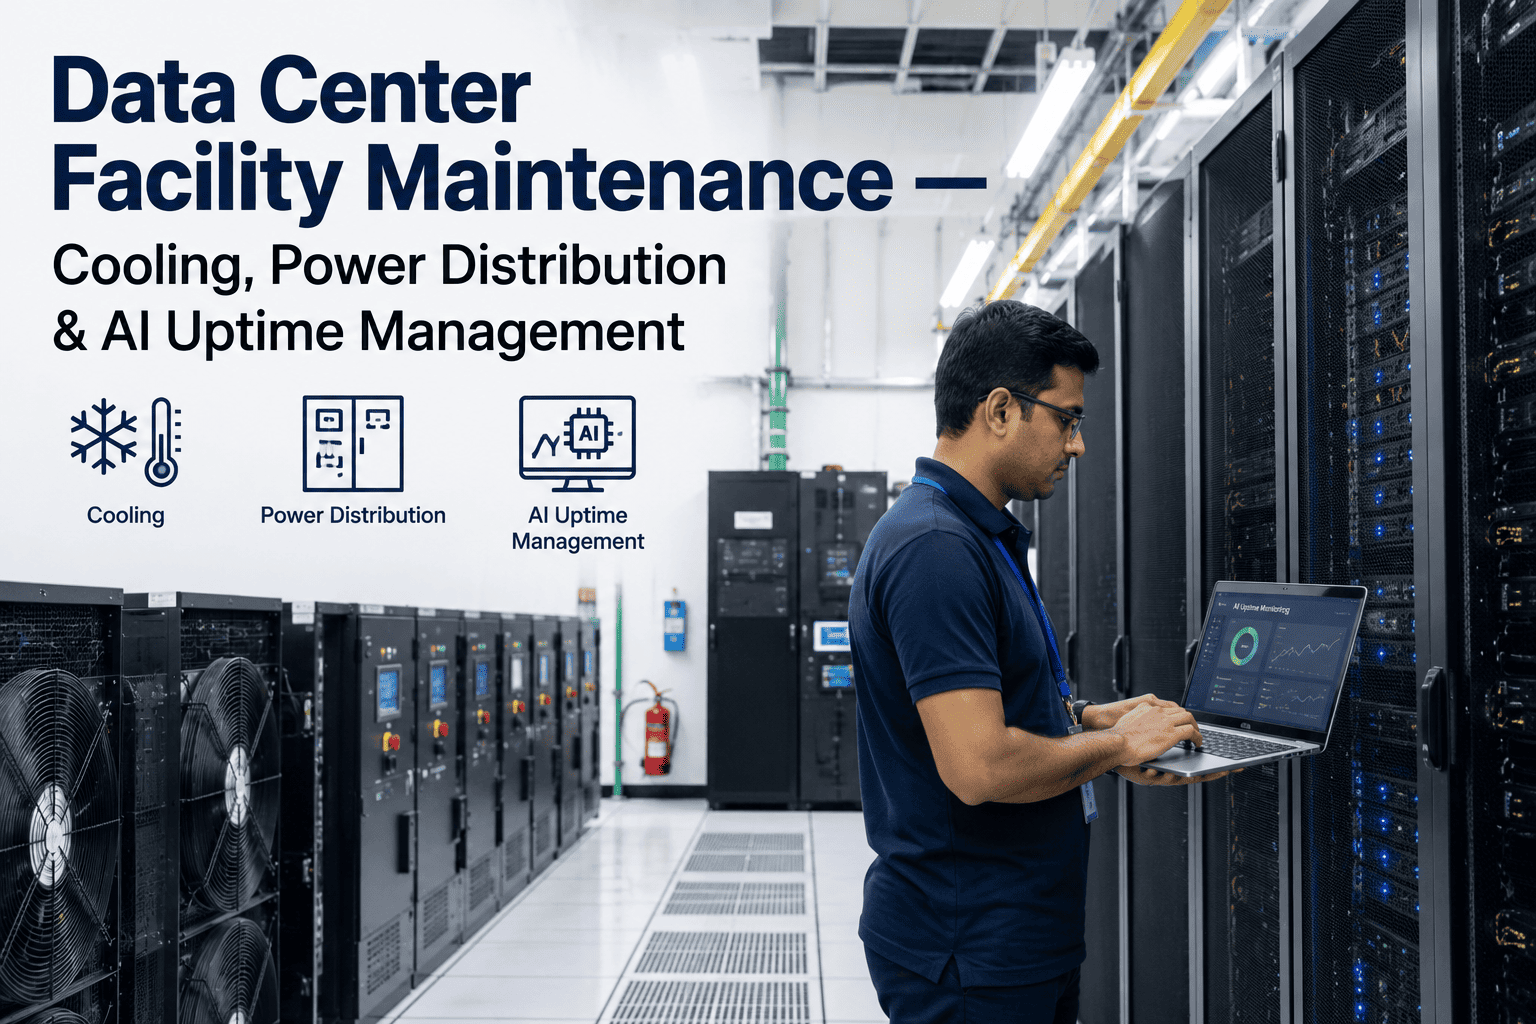
Data Center Facility Maintenance — Cooling, Power Distribution & AI Uptime Management
How cooling systems and power distribution chains actually fail, why standalone BMS alarms are too slow for five-nines facilities, and how AI cross-system monitoring gives operations directors the response time their uptime commitments demand.
The Data Center Facility Stack — Five Layers That Must Not Fail
Data center facility infrastructure is not a collection of independent systems — it is a vertically integrated stack where each layer depends on the one below it, and a failure at any layer can propagate upward faster than human operators can respond if the monitoring system does not detect the cross-layer dependency.
Inlet air temperature, humidity, and airflow at the rack face. This is the layer where the uptime commitment is actually measured — if the rack inlet temperature exceeds the ASHRAE recommended range, the servers are at risk regardless of how well the systems below are performing. This layer is the output of everything below it, which is why monitoring only this layer without visibility into the layers below it cannot diagnose the root cause of an excursion.
Hot aisle containment, cold aisle containment, raised floor plenum pressure, perforated tile airflow rates, and ducted supply systems. The air distribution layer determines whether the cooling capacity produced by the systems below actually reaches the racks that need it. Containment failures, plenum leaks, and tile displacement are the most common causes of hot spots that trigger rack-level temperature alarms without any cooling system having actually failed.
CRAC units, CRAH units, chillers, cooling towers, pumps, and associated piping and valves. This layer produces the cooling capacity that the air distribution layer delivers to the racks. Cooling production failures — compressor lockouts, chiller trips, pump failures, valve stiction — are the most frequent cause of data center thermal events, and they almost always show early warning signs in performance data before they result in a complete loss of cooling.
UPS systems, power distribution units, automatic transfer switches, switchgear, busway, and branch circuit monitoring from the utility input through the power chain to the rack PDU. This layer delivers the power that drives every system above it, including the cooling systems. A power distribution failure can simultaneously take down cooling and IT load, which is why it is the highest-consequence failure mode in the facility stack.
Utility feeds, standby generators, generator fuel systems, automatic transfer switches at the utility level, and utility voltage and frequency monitoring. This is the foundation layer — if utility power is lost and generators do not start and transfer within the UPS ride-through window, every layer above it fails simultaneously regardless of its individual condition.
Power Distribution Chain — Where Failures Propagate Fastest
The power distribution chain in a data center is a series of components with zero redundancy at certain points, and those single points of failure are where operations directors should concentrate their monitoring and maintenance investment because a failure here leaves no time for graceful degradation.
Dual Utility with Automatic Transfer
Most tier III and above facilities have two independent utility feeds with an automatic transfer switch that transitions load to the surviving feed if one fails. The ATS itself is a single point of failure during the transfer event — a contactor that fails to close, a controller that misinterprets the voltage condition, or a mechanical jam that prevents the switch from moving will leave the facility on one feed with no backup. Monitoring the ATS position, transfer time, and voltage during test transfers is the only way to verify it will perform when needed.
Battery Backup and Condition
UPS systems bridge the gap between utility loss and generator start, typically providing 10 to 15 minutes of runtime at full load. The batteries are the critical component — a UPS with degraded batteries may report full charge and healthy status while delivering far less runtime than expected because battery impedance has increased without triggering the alarm threshold. Battery impedance trending, not just voltage monitoring, is the maintenance practice that catches degradation before it matters. Facilities that test batteries only during annual discharge tests are operating with 364 days of uncertainty about whether the UPS will actually perform when called on.
Start Reliability and Fuel Supply
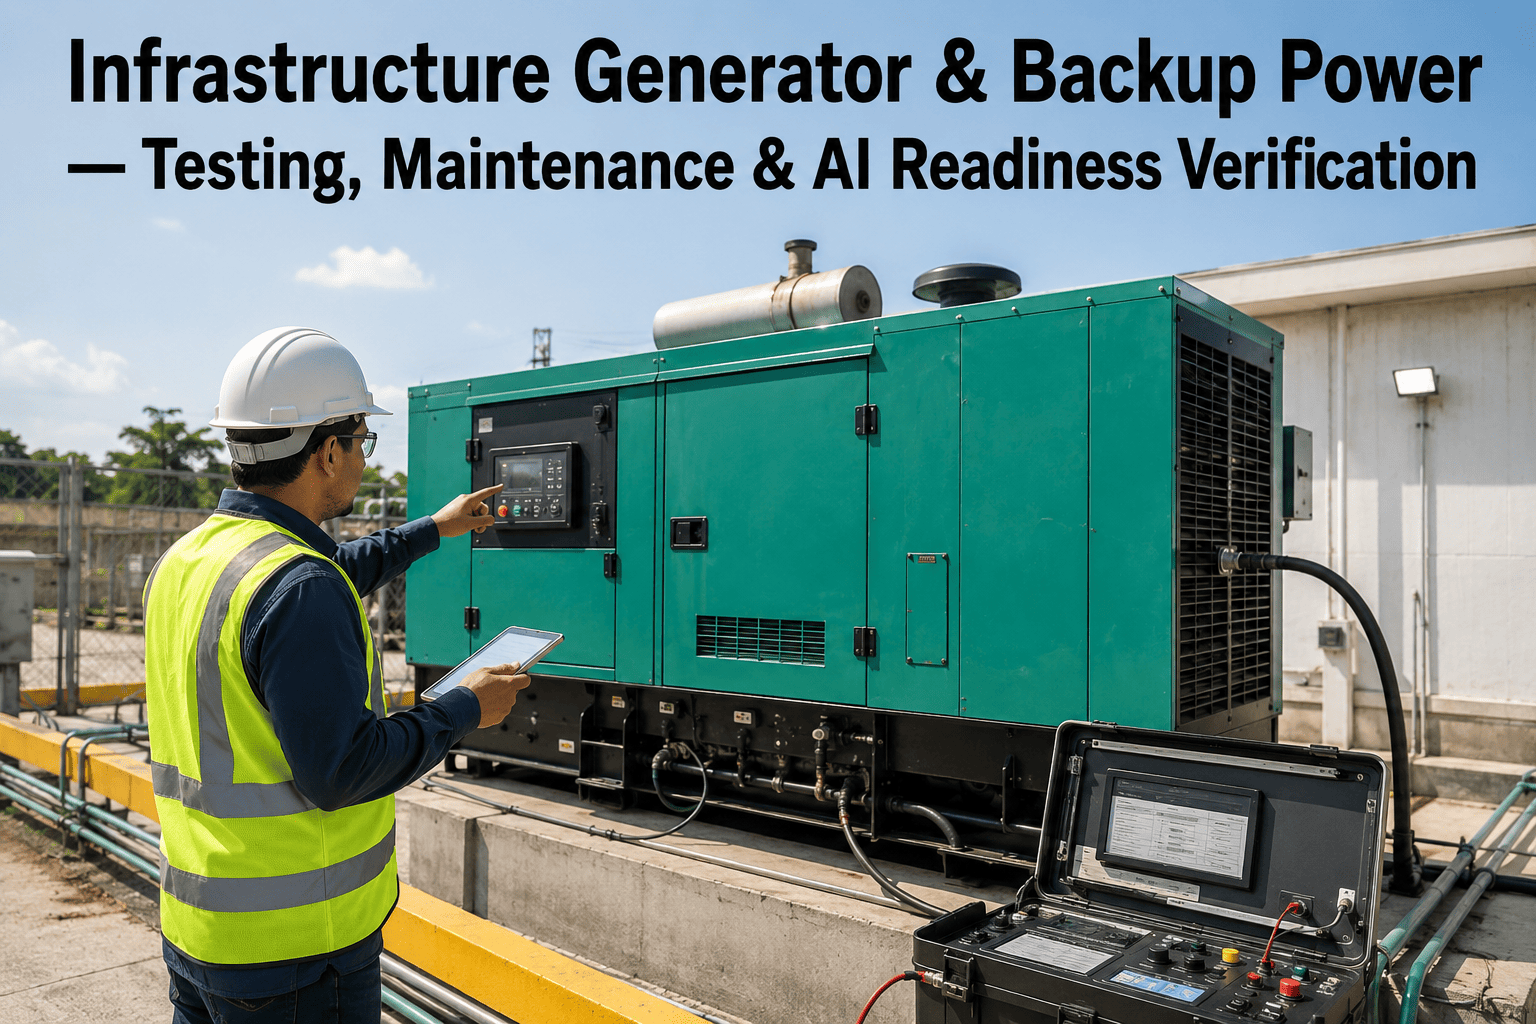
Standby generators must start, reach rated speed, and accept load within the UPS ride-through window — typically under 60 seconds. Start failures are most commonly caused by battery condition in the starter motor, fuel system issues including clogged filters, water in fuel, or air in the injection lines, and mechanical problems in the governor or turbocharger. A generator that fails to start during a utility outage leaves the facility operating on UPS batteries with a countdown timer, and every second of troubleshooting reduces the remaining runtime. Generator exercise with actual load bank testing — not just unloaded running — is the minimum standard for verifying start reliability.
Last Mile Power Delivery
Power distribution units and branch circuits deliver power from the UPS output to the rack PDU inputs. Failure modes here include circuit breaker trips from overcurrent conditions, loose connections that create resistive heating and eventual failure, and phase imbalance that reduces available power capacity on a three-phase PDU. Branch circuit monitoring — measuring current, voltage, and power factor at each circuit — provides visibility into loading trends that predict breaker trips before they occur and detect imbalance conditions that indicate connection problems or load migration.
Cooling System Failure Modes — The Most Frequent Threat to Uptime
Cooling system failures account for a disproportionate share of data center thermal events because cooling systems have more moving parts, more complex control loops, and more vulnerable components than power systems — and because cooling failures can cascade quickly when one unit trips and the remaining units cannot pick up the load.
Compressor and Refrigerant Issues
Chillers are the highest-capacity cooling production equipment in most large data centers, and their failure modes include compressor motor winding degradation, refrigerant charge loss from slow leaks, condenser fouling that reduces heat rejection capacity, and chilled water supply temperature control instability. A chiller that is delivering 90 percent of rated capacity may not trigger an alarm but will reduce the total cooling margin available for load growth or unit failures. Monitoring chiller capacity factor — actual tonnage delivered versus rated tonnage — over time reveals degradation trends that alarm-only monitoring misses entirely. When a facility has N+1 chillers but each chiller is only delivering 85 percent capacity, the effective redundancy has disappeared without any single alarm having fired.
Fan and Valve Degradation
Computer room air handler and air conditioning units at the row or room level rely on fans to move air and valves to control chilled water or refrigerant flow. Fan motor bearing wear increases vibration and reduces airflow without triggering an immediate alarm. Valve actuators develop stiction — a combination of static friction and stick-slip behavior — that causes the valve to lag behind the control signal, creating temperature oscillations in the served zone. These oscillations may stay within alarm limits but indicate a degrading control loop that will eventually fail to maintain setpoint during a load increase or cooling capacity reduction. Trending valve position versus control signal and fan power versus airflow rate catches both failure modes early.
Cavitation and Seal Degradation
Chilled water and condenser water pumps fail most commonly from cavitation damage, mechanical seal leakage, and bearing wear. Cavitation — caused by insufficient net positive suction head — produces a characteristic high-frequency vibration signature and a reduction in pump capacity that can be detected before impeller damage becomes severe. Mechanical seals leak slowly at first, and the leak rate trend is a leading indicator of seal failure that prevents water damage to surrounding equipment if caught early. Pump differential pressure trending compared to the pump curve reveals capacity degradation from impeller wear or cavitation that flow rate monitoring alone may not detect if the system has excess pump capacity.
Fill Degradation and Water Quality
Cooling towers reject heat from the condenser water loop to the atmosphere, and their performance degrades as the fill media fouls with scale, biological growth, and particulate accumulation. Fouled fill reduces the heat transfer surface area and increases the approach temperature — the difference between the condenser water return temperature and the ambient wet bulb temperature. An increasing approach temperature trend indicates fill degradation that is reducing chiller efficiency and capacity. Water treatment program effectiveness, measured by cycles of concentration, corrosion rates, and biological activity, determines how quickly the fill degrades and whether the cooling tower will maintain its rated capacity between maintenance cleanings.
Why Standalone BMS Alarms Are Too Slow for Five-Nines
Building management systems are designed for building comfort control — they excel at maintaining temperature setpoints in office buildings where a five-degree excursion for ten minutes is a comfort complaint, not a service outage. Data center facility operations demand a fundamentally different monitoring approach because the consequences of delayed detection are measured in customer impact and SLA credits rather than tenant complaints.
BMS alarms fire when a single parameter crosses a fixed threshold. A rising supply air temperature that is trending toward the alarm setpoint but has not crossed it yet produces no alert — even though the trend clearly shows the system is heading for an alarm within the next 15 to 30 minutes.
Each BMS alarm evaluates one variable in isolation. A rising rack inlet temperature alarm does not tell the operator whether the cause is a failing CRAH fan, a stuck valve, a chiller capacity reduction, or a containment breach — it just says the temperature is high and leaves root cause diagnosis to the operator's experience and speed.
BMS systems report the current state, not the predicted future state. They cannot tell the operations team that a UPS battery string is trending toward failure in 45 days or that a chiller capacity factor has declined to the point where N+1 redundancy no longer exists. Both of those conditions are detectable from data the BMS already collects, but the BMS does not analyze the data for trends.
AI monitoring analyzes the rate of change of each parameter and generates alerts when the trend projects an alarm condition within a defined time horizon — typically 15 to 60 minutes ahead. The operations team receives a warning that supply air temperature is rising at a rate that will cross the alarm threshold in 22 minutes, giving them time to investigate and intervene before the alarm fires.
When a rack inlet temperature begins rising, AI monitoring simultaneously checks CRAH supply air temperature, chilled water supply temperature, chiller capacity output, and pump differential pressure to identify which system is the root cause. The alert says "rack inlet temperature rising due to CRAH-3 supply air degradation caused by valve stiction on chilled water port" instead of just "rack inlet temperature high."
AI monitoring trends performance metrics like chiller capacity factor, UPS battery impedance, generator start time, and pump differential pressure over weeks and months, projecting when each component will reach its performance threshold. The operations director receives a monthly report showing which components are degrading and how much time remains before intervention is needed — enabling planned maintenance instead of emergency response.
A BMS tells you the temperature is high. AI tells you the temperature will be high in 22 minutes, which CRAH unit is causing it, and which valve is sticking.
iFactory ingests data from your BMS, power monitoring systems, and environmental sensors, then applies cross-system AI correlation that turns thousands of individual data points into root-cause alerts with enough lead time for your operations team to intervene before the SLA is at risk.
Uptime Impact Matrix — Which Failures Cost the Most
Not all facility failures carry the same uptime consequence, and the operations director needs a clear framework for prioritizing maintenance investment based on the actual risk each failure mode poses to the uptime commitment rather than the perceived severity of the equipment involved.
| Failure Mode | Detection Time | Time to Impact | Impact Scope | Recovery Time |
|---|---|---|---|---|
| Utility feed loss with generator start | Instantaneous | UPS ride-through window | Entire facility | Minutes if generators start |
| Generator fail to start | 10-15 seconds into transfer | Remaining UPS battery time | Entire facility | Minutes to controlled shutdown |
| Single chiller trip | Instantaneous | 5-15 minutes to thermal alarm | Zone or facility depending on redundancy | Hours if no spare online |
| CRAH fan failure | 1-3 minutes | 5-10 minutes to rack alarm | Single row or zone | Minutes to swap, hours for repair |
| UPS battery degradation | Weeks to months of trending | Only manifests during utility loss | Entire facility if undetected | Hours for battery string replacement |
| Containment breach | 1-5 minutes | 5-15 minutes to rack alarm | Local hot spot | Minutes to physical correction |
| Pump seal leak | Days to weeks of trending | Hours if leak rate accelerates | Cooling capacity reduction | Hours for seal replacement |
| Generator fuel contamination | Weeks of fuel testing | Only manifests during generator run | Entire facility if generator fails | Hours to days for fuel polishing |
Maintenance Framework — Organized by Failure Consequence
The most effective data center maintenance programs organize tasks by the consequence of failure rather than by equipment type, because the consequence determines how aggressively the maintenance must be scheduled and verified.
Components whose failure causes immediate or near-immediate facility-wide impact with no workaround. Maintenance on these components is scheduled on a time-based or condition-based interval with zero tolerance for deferral. Verification testing — not just visual inspection — is required after every maintenance activity to confirm the component will perform under actual failure conditions.
Generator start and load acceptance testing
UPS battery impedance testing and discharge testing
Utility ATS transfer testing under load
Generator fuel system integrity verification
Components whose failure causes zone-level or system-level impact within minutes, but where redundancy may provide temporary protection. Maintenance is condition-based with defined intervention thresholds, and deferral is allowed only when redundancy verification confirms the backup path is fully functional.
Chiller performance testing and capacity verification
CRAH and CRAC unit functional testing
Chilled water pump and condenser pump performance trending
Electrical connection thermographic survey
Components whose failure causes gradual performance degradation that reduces margin but does not cause an immediate outage. Maintenance is condition-based with longer intervention windows, and the primary risk of deferral is reduced efficiency and reduced redundancy margin rather than immediate customer impact.
Cooling tower fill inspection and cleaning
Water treatment program effectiveness monitoring
Containment system physical inspection
PDU and branch circuit loading analysis
Environmental Monitoring — What to Measure and Where
The sensor placement strategy determines whether the monitoring system can detect problems early enough to respond or whether it will only confirm that a problem has already affected the IT load. Data center environmental monitoring requires a layered approach that measures conditions at multiple points in the facility stack simultaneously.
Temperature and Humidity at the Server Intake
Rack inlet sensors measure the conditions that the servers actually experience, which is the only environmental metric that directly correlates with IT equipment reliability. ASHRAE recommends a minimum of one sensor per rack for critical loads, positioned at the lower front of the rack in the cold aisle. The critical metric is the maximum inlet temperature across all sensors in a zone, not the average — one hot rack in a zone that otherwise looks fine indicates an air distribution problem that average temperature masking will hide. Trending the maximum inlet temperature per zone over time reveals gradual degradation in cooling delivery that precedes alarm conditions.
Supply Air Temperature and Airflow
Supply air temperature sensors at the CRAH or CRAC discharge measure the cooling output that the air distribution layer delivers to the racks. A rising supply air temperature with stable chilled water supply temperature indicates a fan problem or airflow restriction in the unit. Stable supply air temperature with rising rack inlet temperature indicates an air distribution problem between the unit and the racks — containment breach, plenum leak, or tile displacement. Comparing supply air temperature to rack inlet temperature quantifies the temperature rise across the air distribution path, which should be relatively constant under stable load conditions.
Supply and Return Temperature, Flow Rate, Pressure
Chilled water supply and return temperatures with flow rate measurement at each CRAH or CRAC unit provide the data needed to calculate actual cooling capacity delivered by each unit. The difference between supply and return temperature multiplied by flow rate equals the cooling tonnage being delivered. Comparing delivered tonnage to the unit's rated capacity produces the capacity factor that reveals chiller, pump, and heat exchanger degradation over time. Pressure drop across the chilled water loop reveals fouling or flow restrictions that reduce available capacity.
Voltage, Current, Power Factor at Each Level
Power monitoring at the utility input, UPS output, PDU input, and branch circuit level provides visibility into the entire power chain from utility to rack. Voltage stability at each level reveals regulation problems. Current trending at each branch circuit reveals load growth that may approach breaker trip thresholds. Power factor trending reveals changes in load characteristics that affect available real power capacity. The most valuable insight from power monitoring is the ability to calculate headroom — the remaining capacity between current load and rated capacity at each level — and trend it over time to predict when capacity additions will be needed.
Cross-System Failure Scenarios — Why Isolated Monitoring Misses the Problem
The most dangerous failure scenarios in data center facilities are not single-component failures — those are usually caught by BMS alarms — but cross-system scenarios where an interaction between two or more systems creates a risk that no single-system alarm can detect.
Chiller Capacity Erosion Masked by Redundancy
Three chillers are installed with N+1 redundancy. Over 18 months, scale buildup in two chillers reduces each to 80 percent capacity. The third chiller is healthy at 100 percent. Under normal load at 60 percent of total rated capacity, all three chillers run at reduced output and no alarm fires because the total available capacity still exceeds the load. When one chiller trips on a safety shutdown, the remaining two degraded chillers cannot deliver enough capacity to maintain supply temperature, and the facility experiences a thermal event. No single chiller alarm predicted this because each chiller was still operating within its individual alarm limits. Only cross-system analysis that compares total available cooling capacity against total IT load would have flagged the eroded redundancy margin.
Generator Fuel System Degradation During Extended Outage
Generators start successfully during a brief utility outage and run for 20 minutes until utility power is restored. The fuel system passes this test, but a slow fuel filter clog that does not affect short-duration operation goes undetected. Six months later, an extended outage requires the generators to run for eight hours. At hour three, the clogged filter restricts fuel flow enough to cause the generator to lose frequency and be tripped by the protective relay. The UPS batteries, which were sized for a 15-minute bridge to generator start, now have to support the load until utility power is restored — which may be hours away. Fuel system monitoring that trends filter differential pressure and fuel flow rate during every generator exercise would have detected the clog before it became a runtime limitation.
Cooling and Power Interaction During Load Shed
A power system fault causes the UPS to transfer to battery and the generators to start. During the transfer, a momentary voltage dip causes several CRAH units to restart, and their fans go through a soft-start ramp that reduces airflow for 60 to 90 seconds. Simultaneously, the IT load may shed and then recover, creating a transient thermal load profile that the reduced cooling airflow cannot handle. The rack inlet temperature spikes during the 90-second fan recovery period, potentially triggering server thermal shutdowns even though the power system performed correctly and the cooling systems are individually healthy. Cross-system monitoring that correlates power transfer events with cooling system restart behavior can pre-program fan restart sequences that prevent the airflow gap.
KPIs Every Data Center Operations Director Should Track
Operational KPIs for data center facility maintenance must be specific enough to drive action and frequent enough to reveal trends. Annual metrics are useless for preventing failures — the operations director needs metrics that update continuously and that connect facility condition to the uptime commitment.
Power Usage Effectiveness trending over 30-day rolling windows reveals whether the facility is becoming more or less efficient, which is a leading indicator of cooling system degradation. A rising PUE with stable IT load means the facility overhead — primarily cooling — is consuming more power to deliver the same cooling result, which almost always indicates a maintainable problem like chiller fouling, pump degradation, or air distribution deterioration.
Total available cooling capacity minus current IT thermal load, expressed as a percentage of required capacity. This metric should be calculated in real time and trended over time. A declining cooling margin that no single equipment alarm explains is the signature of gradual multi-unit degradation — exactly the cross-system scenario that causes the most dangerous thermal events.
Rated capacity minus actual load at each level of the power chain, from UPS to PDU to branch circuit. Branch circuits approaching 80 percent loading should trigger capacity planning action. PDUs approaching 70 percent loading on any phase should trigger load rebalancing. The operations director should be able to see headroom at every level in a single view.
Percentage of generator start attempts that result in successful load acceptance within the required time window, tracked over rolling 12-month periods. A declining start reliability trend — even if it remains above the minimum acceptable threshold — indicates a developing problem in the starting system, fuel system, or control logic that will eventually produce a failure to start during an actual outage.
Frequently Asked Questions
Can AI monitoring integrate with our existing BMS without replacing it?
AI monitoring systems designed for data center facilities are built to ingest data from existing BMS platforms, power monitoring systems, environmental sensors, and UPS controllers through standard protocols like BACnet, Modbus, SNMP, and REST APIs. The AI layer sits above the BMS — it does not replace the BMS or its control functions. The BMS continues to perform its intended role of controlling setpoints and managing equipment sequences, while the AI layer analyzes the data the BMS is already collecting to provide the trend analysis, cross-system correlation, and predictive capabilities that the BMS was not designed to deliver. The integration typically requires mapping the BMS data points to the AI platform's data model, which is a configuration exercise rather than a rip-and-replace project. Book a demo to see how iFactory connects to existing data sources without disrupting your BMS.
How is data center facility maintenance different from commercial building maintenance?
The fundamental difference is the consequence of failure and the speed at which problems escalate. In a commercial building, an HVAC failure creates a comfort complaint that the facilities team has hours to address. In a data center, a cooling failure creates a thermal event that can trigger server shutdowns in five to fifteen minutes, resulting in customer impact, SLA credits, and potential revenue loss that dwarfs the maintenance cost of preventing the failure. This difference drives three key distinctions: maintenance intervals must be shorter and more rigorously verified, monitoring must provide early warning rather than post-fact notification, and spare parts inventory must support rapid repair rather than next-day delivery. The operations director who applies commercial building maintenance practices to a data center facility is systematically under-maintaining the infrastructure that supports the uptime commitment. Contact support to discuss how iFactory adapts maintenance frameworks to data center-specific requirements.
What is the minimum sensor density needed for effective AI environmental monitoring?
For AI environmental monitoring to provide meaningful cross-system correlation, the minimum sensor density is one temperature and humidity sensor per rack for critical IT loads, supply air temperature and humidity sensors at each CRAH or CRAC unit, chilled water supply and return temperature sensors with flow measurement at each cooling unit, and power monitoring at each PDU input and at least at the critical branch circuit level. Below this density, the AI system has insufficient spatial resolution to distinguish between local air distribution problems and system-level cooling problems, which reduces its diagnostic accuracy. The incremental cost of sensors above this minimum provides diminishing returns for AI correlation purposes, though additional sensors may be justified for compliance reporting or customer-specific monitoring requirements.
How do we justify the investment in AI monitoring to leadership when the BMS already generates alarms?
The justification framework that resonates with leadership is the cost of the incidents that AI monitoring would have prevented or mitigated. A single thermal event that causes a controlled shutdown of a single hall can cost hundreds of thousands of dollars in SLA credits, emergency labor, customer churn, and reputational damage — a cost that typically exceeds the annual investment in AI monitoring by a significant multiple. The operations director should present the business case as an insurance premium against incident costs, supported by a historical analysis of the facility's incident record showing how many events had detectable precursor patterns that the BMS did not alert on. If the facility has not had a major incident, the argument is that the absence of incidents is not evidence of low risk — it is evidence that the facility has been lucky, and luck is not a maintenance strategy. Book a demo to get the data points you need to build the business case.
Should AI monitoring replace our existing preventive maintenance program or supplement it?
AI monitoring supplements and optimizes the existing preventive maintenance program — it does not replace it. There are maintenance tasks that require physical intervention regardless of what the monitoring data shows: generator oil changes, UPS battery replacements at end of life, cooling tower fill cleaning, electrical connection torque verification. AI monitoring adds value by determining the optimal timing for those tasks based on actual condition rather than calendar intervals, and by detecting the degradation patterns between maintenance intervals that would otherwise go unnoticed. The facilities that get the most value from AI monitoring are those that use it to transition from time-based maintenance to condition-based maintenance for Tier 1 and Tier 2 components, reducing unnecessary maintenance on healthy equipment while concentrating resources on the components that are actually degrading. The preventive maintenance program becomes smarter and more targeted, not smaller.
Your BMS generates thousands of alarms. Your operations team needs the five that matter — with root cause, projected impact, and enough lead time to act.
iFactory correlates cooling, power, and environmental data across your entire facility stack, filters out the noise, and delivers cross-system root-cause alerts that tell your operations team exactly what is happening, why it is happening, and how long they have to fix it.