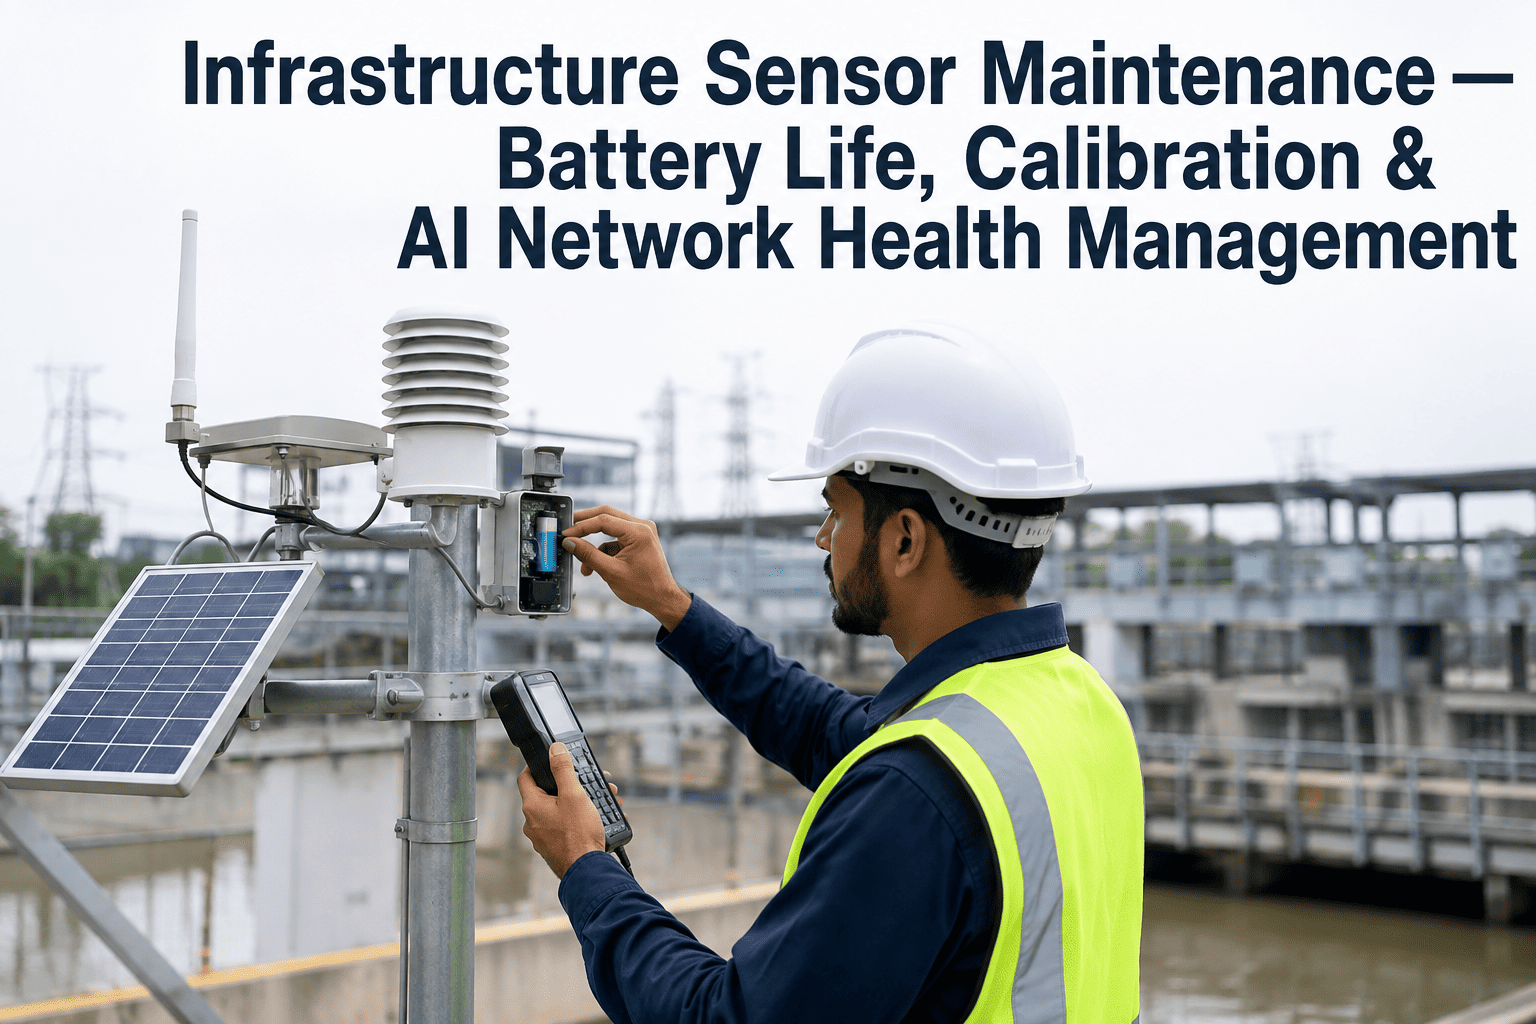
A vibration sensor on a bridge expansion joint can keep transmitting a perfectly normal-looking signal for months after it has actually drifted out of calibration, because a failed or drifting sensor rarely stops sending data, it just starts sending the wrong data with total confidence. Nobody notices until an inspection turns up a crack that the monitoring system should have flagged weeks earlier, and by then the question is not just why the crack happened but why the sensor network stayed quiet while it formed. Most infrastructure monitoring programs manage this risk with a calendar, recalibrating every sensor on a fixed schedule whether it needs it or not, which wastes labor on sensors that are fine and misses the ones drifting fast between visits. iFactory's infrastructure sensor calibration and data reliability platform tracks drift, completeness, and accuracy continuously across every connected sensor, so problems surface before they reach a report, and you can book a demo to see it running against your own sensor network.
INFRASTRUCTURE IOT · SENSOR RELIABILITY · CALIBRATION MANAGEMENT
Your Sensors Are Still Talking, the Question Is Whether They Are Still Telling the Truth
iFactory continuously scores every connected sensor on drift, completeness, and accuracy, flags calibration needs before a reading becomes unreliable, and keeps a full audit trail so your monitoring data actually holds up to scrutiny.
NETWORK RELIABILITY SNAPSHOT
THE SILENT FAILURE PROBLEM
Why a Sensor Going Bad Is More Dangerous Than a Sensor Going Dark
A sensor that stops transmitting is easy to catch, it shows up as a gap in the dashboard and someone gets a ticket the same day. A sensor that keeps transmitting while its calibration drifts is far harder to catch, because the readings still look plausible on their own, they just no longer reflect what is actually happening to the structure or asset being monitored. That gap between plausible and true is exactly where the risk lives, and it grows quietly every day a fixed calibration schedule leaves a drifting sensor unchecked between visits.
60%+
Of sensor faults in field deployments involve drift rather than outright failure
6-12 mo
Typical interval for fixed-schedule recalibration, regardless of actual sensor condition
3x
More technician visits than needed when every sensor is recalibrated on the same calendar
FIVE QUALITY DIMENSIONS
What "Reliable Sensor Data" Actually Means, Broken Into Five Measurable Parts
Data reliability is not a single yes-or-no property, and treating it that way is how drifting sensors slip through unnoticed. iFactory scores every sensor stream across five dimensions drawn from established data quality practice, so a problem in one dimension gets flagged even when the others still look fine.
01
Completeness
Are the expected readings actually arriving on schedule, or are gaps forming that signal a network or power issue?
02
Accuracy
Do readings still fall within the expected range for the physical condition being measured, or has the sensor drifted from ground truth?
03
Freshness
How old is the data relative to the event it describes, since a delayed reading can be as misleading as a wrong one?
04
Consistency
Do related sensors on the same asset agree with each other, or has one quietly diverged from the group?
05
Validity
Does each reading conform to its expected format, unit, and value range, catching configuration errors before they reach a report?
HOW IT WORKS
From Raw Telemetry to a Trustworthy Reading in Four Steps
The platform sits between your sensor network and the dashboards, reports, and alerts your team already relies on, continuously checking the health of the data itself before anyone downstream acts on it.
1
Continuous Ingestion
Telemetry streams in from every connected sensor, whether it reports every second or once an hour, without disrupting your existing collection setup.
2
Drift and Anomaly Scoring
Each stream is checked against its own calibration baseline and against related sensors on the same asset, catching slow drift that a single-point check would miss.
3
Condition-Based Alerting
A sensor gets flagged for recalibration when its own behavior signals it needs attention, not because a fixed date on the calendar arrived.
4
Certified Calibration Log
Every calibration event, correction, and drift flag is logged with a timestamp and technician record, building the audit trail regulators and insurers ask for.
Because the scoring runs continuously rather than at a scheduled check-in, a sensor that starts drifting on a Tuesday does not wait for its next quarterly visit to get flagged, it shows up on the reliability dashboard the same day the pattern starts to diverge from its baseline.
Stop Finding Out Your Sensors Were Wrong After the Fact
iFactory scores every connected sensor on drift, completeness, and accuracy in real time, so a problem gets flagged while it is still small. Book a demo and connect a sample of your own sensor network to see it scored live.
CALIBRATION STRATEGY COMPARISON
Fixed Schedule, Manual Spot Check, or Condition-Based, What Actually Reduces Risk
Most infrastructure operators run one of three calibration strategies today, and each one trades cost against risk differently. Seeing them side by side makes clear why condition-based calibration keeps winning out as sensor networks scale past a few dozen devices.
The shift toward condition-based calibration mirrors what already happened in equipment maintenance, where fixed-interval servicing gave way to condition monitoring once the data existed to support it. Sensor networks are following the same path, and the data quality layer is what makes that shift possible.
WHERE IT FITS
Four Places Sensor Reliability Management Pays for Itself
Once the reliability layer is in place, it becomes a standing safeguard across every kind of connected infrastructure asset, not a tool reserved for one type of sensor or one type of failure.
01
Structural Health Monitoring
Track vibration, strain, and displacement sensors on bridges and buildings, catching drift before it undermines a safety-critical reading.
02
Water and Utility Networks
Keep flow, pressure, and quality sensors across a distribution network trustworthy enough to base operational decisions on.
03
Plant and Process Monitoring
Validate the temperature, pressure, and vibration sensors feeding predictive maintenance models, since a drifting input quietly corrupts every prediction built on it.
04
Environmental Compliance Reporting
Maintain a defensible calibration record for regulatory reporting, so an audit does not turn up gaps in when sensors were last verified.
WHY IT WORKS BETTER
A Dashboard Is Only as Trustworthy as the Sensors Feeding It
Most infrastructure monitoring programs invest heavily in the dashboard layer, the alerts, the visualizations, the reports that go to leadership, while spending very little on verifying that the underlying sensor data feeding all of it is still accurate. That is backwards, because every downstream decision, from a maintenance work order to a public safety call, is only as good as the readings it was built on. A beautifully designed dashboard displaying drifted data is more dangerous than a plain one, because it projects a confidence the underlying numbers no longer deserve.
Condition-based calibration flips that priority. Instead of trusting a sensor until a scheduled check proves otherwise, the platform continuously tests whether each sensor's own behavior still supports trusting it, cross-checking related sensors against each other and against historical baselines. When a sensor's readings quietly diverge from its own history or from its neighbors, that divergence itself becomes the signal, often catching drift weeks before it would have shown up as an obviously wrong number on a report.
MEASURED RESULTS
What Operators Report After Deploying Continuous Sensor Reliability Scoring
These figures reflect outcomes reported by infrastructure operators after moving from fixed-schedule calibration to continuous, condition-based sensor reliability management.
40-55%
Fewer Unnecessary Calibration Visits
Technician time redirects to sensors actually showing drift instead of every sensor on a fixed calendar.
70%+
Faster Detection of Drifting Sensors
Continuous scoring catches drift while it is still small, well before it would surface in a scheduled check.
99%+
Calibration Records Fully Traceable
Every calibration event and drift flag is logged automatically, closing gaps that used to appear in paper records.
25%+
Fewer Downstream Data Disputes
Teams spend less time arguing over whether a reading is real once every stream carries a live reliability score.
ROLLOUT PLAN
How Operators Introduce Continuous Reliability Scoring Without Disrupting Existing Monitoring
Sensor reliability management works best layered onto an existing monitoring setup rather than replacing it outright, so the transition can happen without any gap in coverage.
1
Connect a Priority Sensor Group
Start with the sensors tied to the highest-consequence readings, such as structural monitoring or safety-critical process points, and establish their reliability baseline.
2
Run Reliability Scoring in Parallel
Let the continuous scoring run alongside your existing fixed-schedule calibration for one cycle, comparing what each approach would have caught.
3
Shift to Condition-Based Scheduling
Once the parallel run validates the approach, move technician calibration schedules onto the reliability flags instead of the calendar, across the full sensor network.
FREQUENTLY ASKED QUESTIONS
Questions Teams Ask Before Rolling Out Sensor Reliability Management
Can this work with the sensor hardware and protocols we already have deployed?
The platform is built to ingest telemetry from a wide range of existing sensor types and communication protocols, so most operators do not need to replace hardware to start scoring reliability. It sits alongside your current data collection setup rather than requiring a rip-and-replace of the sensor network itself, which keeps the initial rollout focused on the software layer rather than a hardware refresh. Legacy sensors with limited reporting frequency are still scored on the dimensions their data supports.
Book a demo to confirm compatibility with your current sensor fleet and protocols.
How does the platform tell the difference between a real physical event and a sensor drifting out of calibration?
Drift shows up as a slow, consistent divergence from a sensor's own historical baseline and from related sensors on the same asset, while a real physical event typically produces a sharp, correlated change across multiple sensors at once. The scoring model is built specifically to separate these two patterns rather than treating every anomaly the same way, since flagging a real structural event as a calibration issue would be just as costly as missing genuine drift. Flagged sensors are surfaced with enough context for a technician to confirm which pattern actually occurred.
Contact our support team to review how the drift-versus-event distinction is scored for your sensor types.
Do we still need periodic hardware calibration, or does this replace it entirely?
Continuous reliability scoring tells you when a sensor needs attention, but a physical recalibration against a certified reference standard is still how the correction actually happens, so the two work together rather than one replacing the other. What changes is the trigger, instead of every sensor going in for calibration on the same fixed date regardless of condition, only the sensors the scoring flags get pulled for service. This is what drives most of the reduction in unnecessary technician visits.
Contact our support team to map out how condition-based triggers would apply to your calibration program.
Can the reliability scores feed directly into our existing dashboards and alerting system?
Yes, reliability scores and drift flags can be exported alongside the raw sensor readings, so your existing dashboards can display a trust indicator next to every value rather than presenting all readings as equally certain. This also lets alerting rules incorporate reliability directly, suppressing alerts triggered by a drifting sensor while still surfacing genuine anomalies from healthy ones. The goal is to make reliability a visible property of the data, not a separate report nobody checks.
Book a demo to see reliability scores layered onto a sample dashboard view.
How much historical data do we need before the platform can start scoring drift accurately?
A baseline can be established from a few weeks of normal operating data for most sensor types, though sensors with strong seasonal patterns benefit from a longer history to avoid mistaking a seasonal shift for drift. The platform continues refining each sensor's baseline as more data accumulates, so accuracy improves over the first few months of deployment rather than requiring a long historical backlog before it becomes useful. Early scoring is intentionally conservative until enough history builds confidence in the baseline.
Contact our support team to discuss baseline requirements for your specific sensor mix.
Make Every Reading From Your Sensor Network One You Can Actually Trust
iFactory continuously scores completeness, accuracy, freshness, consistency, and validity across your entire sensor fleet, catching drift while it is still small. Book a demo and see your own network scored in real time.