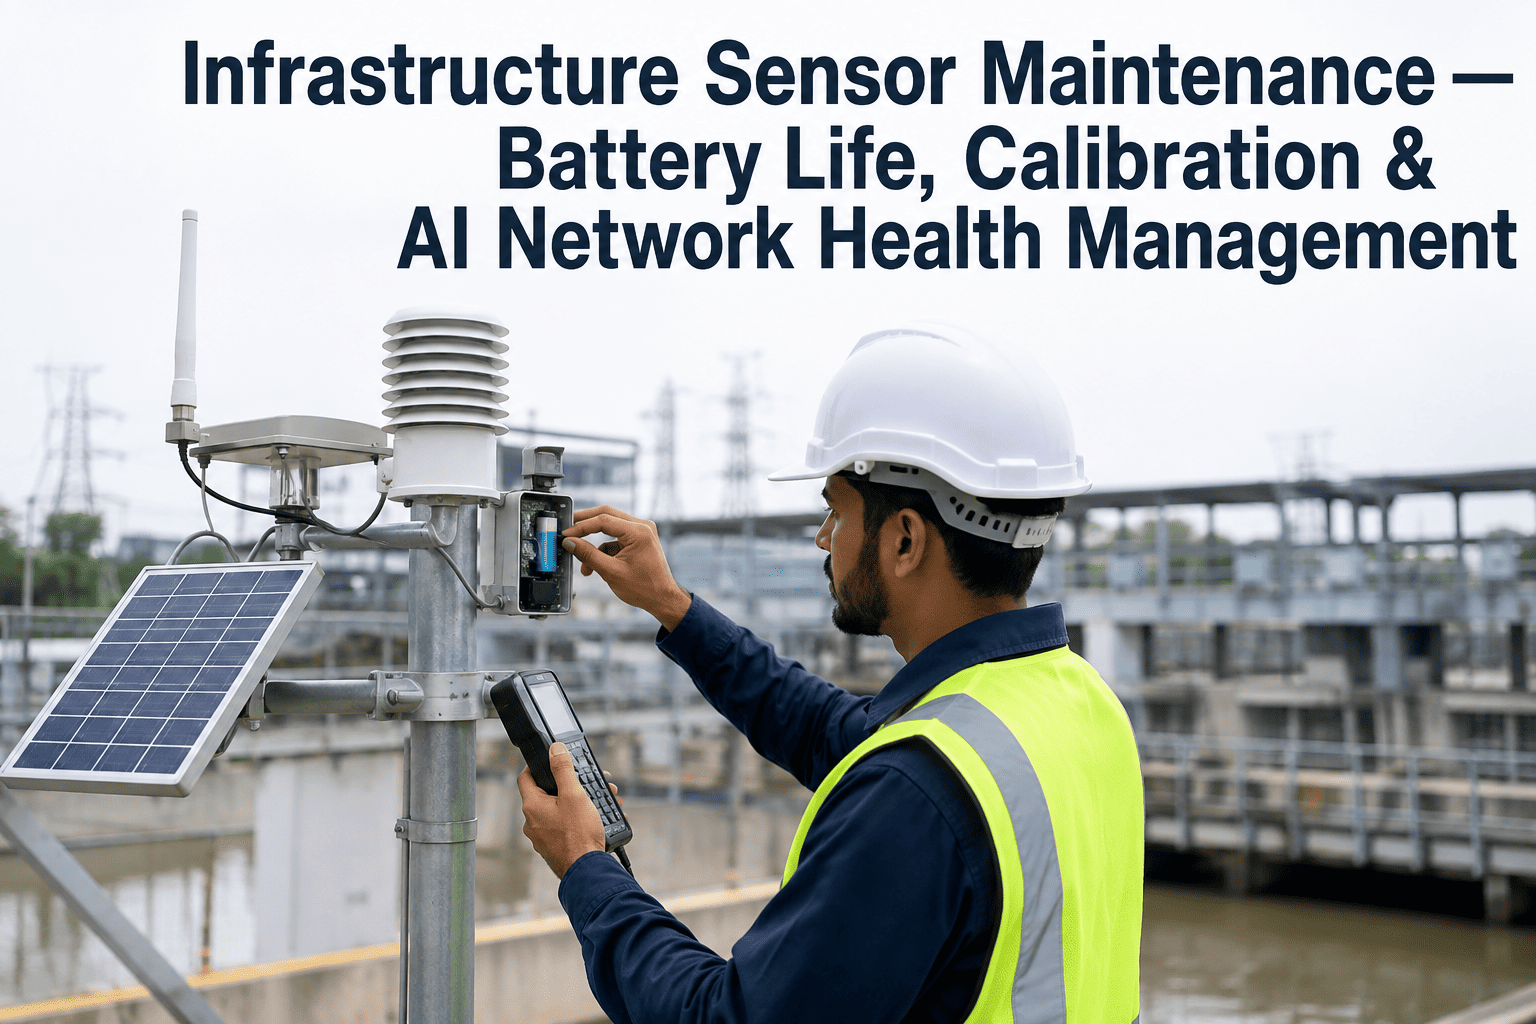
A sensor that's still reporting numbers isn't the same as a sensor reporting the truth. Batteries drain unevenly across a deployed network, calibration drifts months before anyone notices the readings have quietly wandered off, and a gateway losing packets can make an entire zone look calm right when conditions are changing fastest. Maintenance teams running a few dozen sensors can catch this by hand. Teams running a few thousand across a plant, campus, or distribution network cannot, and that gap is exactly where bad decisions get made on data nobody knew was already unreliable. iFactory's AI network health layer watches battery life, calibration status, and communication quality across every sensor continuously, catching the drift before it becomes a blind spot — see how the health scoring maps to your current sensor fleet.
IoT & Smart Sensor Management
Know Which Sensors Are Lying to You Before the Data Does
iFactory continuously scores every deployed sensor on battery life, calibration drift, and communication health, so maintenance teams stop discovering dead zones and stale readings during an incident review.
The Blind Spot Growing Inside Every Sensor Deployment
Sensor networks fail slowly, not suddenly. A battery doesn't drop from full to dead; it declines in a curve shaped by temperature, transmission frequency, and interval settings that vary sensor by sensor. Calibration doesn't snap out of spec; it drifts a fraction of a percent at a time until a reading that looks perfectly normal is actually off by enough to hide a real problem. Communication doesn't cut out cleanly either — a gateway can sit at 60% packet loss for weeks, still delivering just enough data to avoid triggering an obvious alarm while quietly degrading the confidence of everything built on top of it.
None of these failure modes show up on a maintenance team's radar until someone goes looking, and most teams only go looking after a report doesn't match reality. iFactory's AI network health layer scores every sensor continuously against its own historical baseline, flagging battery decline curves, calibration drift, and communication degradation as trends rather than waiting for a hard failure to force the issue.
01
Battery Life Prediction
AI models each sensor's discharge curve against its transmission interval, temperature exposure, and radio activity, forecasting remaining runtime instead of relying on a flat low-battery threshold that triggers too late to plan a swap.
02
Calibration Drift Detection
Readings are continuously compared against expected ranges, cross-sensor consensus, and known drift patterns for the sensor type, surfacing calibration decay long before values fall outside a hard alarm limit.
03
Communication Health Scoring
Packet loss, signal strength, retry counts, and gateway hop reliability are scored per sensor and per zone, catching degraded links before they drop enough packets to trip a connectivity alarm outright.
60%
packet loss a gateway can sustain before triggering a standard connectivity alarm
Weeks
of undetected calibration drift typical before a manual spot-check catches it
1000s
of sensors a single maintenance team is expected to keep healthy manually
How a Sensor's Health Actually Declines
Day 0
Healthy Baseline
Sensor installed and calibrated, battery fresh, signal strong, readings tracking tightly with neighboring sensors and expected ranges.
Weeks 4-8
Early Drift
Battery discharge curve starts diverging from the fleet norm, calibration shows a small but consistent offset, still well within any fixed alarm threshold.
Weeks 8-16
Degraded Confidence
Signal retries increase, packet loss climbs steadily, and calibration offset widens enough to meaningfully affect downstream decisions without tripping a hard alarm.
Week 16+
Hard Failure or Silent Bad Data
Sensor either drops offline entirely, prompting a reactive truck roll, or keeps reporting numbers that look plausible but no longer reflect reality.
Every Silent Sensor Is a Decision Made on Bad Data
Stop finding out a zone went dark three weeks ago. iFactory scores battery, calibration, and communication health across your entire fleet continuously, not on a spot-check schedule.
Manual Spot-Checks vs. Continuous AI Health Scoring
| Capability |
Manual Spot-Check Maintenance |
Continuous AI Health Scoring |
| Battery Management |
Fixed replacement schedule or reactive swap after a sensor goes dark. |
Predicted remaining runtime per sensor based on its actual discharge curve. |
| Calibration Checks |
Periodic manual verification, often quarterly or annually across a large fleet. |
Continuous drift detection against historical baseline and cross-sensor consensus. |
| Communication Issues |
Discovered when a hard connectivity alarm trips or a report looks wrong. |
Flagged as packet loss and signal degradation trend upward, before failure. |
| Data Quality Confidence |
Assumed good unless something obviously breaks. |
Scored per sensor continuously, with degraded sensors flagged for review. |
| Maintenance Effort at Scale |
Scales linearly with sensor count, eventually exceeding team capacity. |
Scales with exceptions flagged, not with total sensor count. |
Four Failure Patterns Fleet Health Scoring Catches
Battery
Sensors in high-transmission zones or extreme temperature exposure draining far faster than the fleet average, missed entirely by a uniform replacement schedule built around typical conditions.
Calibration
A sensor gradually reading low or high relative to its neighbors, staying inside any fixed alarm band while steadily eroding the accuracy of trend analysis built on its data.
Communication
A gateway with a marginal connection dropping enough packets to create gaps in the record without ever crossing the threshold that would trigger a standard offline alarm.
Data Quality
A sensor reporting values that are technically within range but statistically inconsistent with its own recent history, a pattern only visible when compared against a rolling baseline.
Rolling Out Fleet Health Monitoring
Phase 1
Baseline Establishment
Historical data from the existing sensor fleet is analyzed to establish normal battery discharge, calibration, and communication ranges for every sensor type and deployment zone.
Phase 2
Health Scoring Activation
Continuous scoring goes live across battery, calibration, and communication dimensions, with exception thresholds tuned against the established baseline before alerts start firing.
Phase 3
Maintenance Workflow Integration
Flagged sensors route directly into existing maintenance workflows, turning a health score into a scheduled battery swap, recalibration, or gateway check rather than a standalone dashboard alert.
Phase 4
Fleet-Wide Optimization
Patterns across the full fleet inform transmission interval tuning, gateway placement, and replacement cadence, reducing the rate at which new issues appear in the first place.
Common Mistakes in Sensor Fleet Maintenance
Relying on Fixed Battery Schedules
A uniform replacement interval either wastes budget replacing batteries with life left or misses sensors draining faster than average, both of which continuous discharge-curve tracking avoids.
Trusting Readings That Look Plausible
A value inside the expected range isn't automatically a value that reflects reality. Drift detection catches sensors that are technically in range but statistically off from their own history.
Treating Connectivity as Binary
Sensors don't just go online or offline. A degrading signal can sit in a partially-functional state for weeks, quietly dropping data before a hard alarm ever triggers.
Skipping Cross-Sensor Comparison
A single sensor evaluated in isolation can look fine even when it's clearly diverging from every neighboring sensor covering the same conditions, a signal only visible in fleet-wide comparison.
Frequently Asked Questions
How does AI predict battery life more accurately than a fixed schedule?
Battery discharge depends on transmission frequency, temperature exposure, radio retry activity, and the specific hardware batch, all of which vary sensor by sensor across a deployment. AI models each sensor's actual discharge curve against these factors instead of applying one flat interval to the whole fleet, catching sensors draining faster than expected while avoiding unnecessary early swaps on sensors with plenty of life left.
Book a demo to see battery forecasting against your own sensor data.
Can this work with our existing sensor hardware and gateways?
Yes. The health scoring layer reads existing telemetry, battery voltage reporting, and communication metadata already flowing from deployed sensors and gateways rather than requiring new hardware. Most fleets already generate the signal needed for drift and battery scoring; it simply isn't analyzed continuously today.
What counts as calibration drift versus a real change in conditions?
Drift detection compares a sensor's readings against its own historical baseline and against neighboring sensors covering similar conditions, distinguishing a gradual individual offset from a genuine shift affecting the whole zone. A sensor consistently reading apart from its neighbors over time is flagged as drift; a shift matching the surrounding fleet is treated as a real environmental change.
How quickly can a communication issue be caught before it becomes a data gap?
Packet loss, signal strength, and retry counts are scored continuously rather than checked on a fixed interval, so a gateway or sensor link trending toward failure is flagged while it's still delivering most of its data, not after it goes fully dark.
Talk to support about connecting your gateway telemetry into fleet health scoring.
How does this fit into our existing maintenance workflow?
Flagged sensors generate maintenance actions — a battery swap, a recalibration visit, a gateway check — routed directly into the workflow your team already uses, rather than adding a separate dashboard someone has to remember to check. The goal is fewer surprise truck rolls and more scheduled, predictable maintenance visits.
Stop Trusting Sensors You Haven't Verified in Months
iFactory continuously scores battery life, calibration status, and communication health across your entire sensor fleet, so your maintenance team acts on real degradation trends instead of discovering problems during an incident review.
Battery runtime predicted from each sensor's actual discharge curve
Calibration drift caught weeks before it affects decisions
Communication health scored continuously, not on a fixed check-in
Flagged sensors routed directly into your maintenance workflow