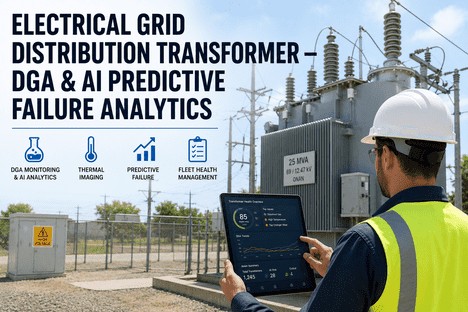
Electrical Grid Distribution Transformer — DGA & AI Predictive Failure Analytics
By Grace on June 22, 2026
The US grid alone depends on an estimated 60 to 80 million distribution transformers — and more than half of them are over 33 years old, operating well beyond their design life. A single distribution transformer failure can leave thousands of customers without power for hours, cost a utility tens of thousands in emergency repair and replacement, and trigger a cascade of grid instability that compounds across the network. With transformer lead times stretching to 120 weeks and costs running four to six times pre-2022 levels, the old strategy of running transformers to failure and replacing them on an emergency basis is no longer financially viable — or operationally responsible. The global predictive maintenance market is projected to grow from $5.9 billion to $32.3 billion by 2030 at a 27.4% CAGR, driven precisely by this reality: utilities and grid operators can no longer afford to wait for equipment to fail. They need to know which transformers are degrading, which are critical, and which can wait — before the outage happens.
Distribution Transformer Monitoring · DGA Analytics · AI Predictive Failure · Grid Reliability
The Average Distribution Transformer Is 33 Years Old. Your Grid Cannot Afford to Wait for It to Fail.
iFactory's transformer fleet analytics module combines AI-driven dissolved gas analysis, thermal imaging integration, and predictive failure algorithms to give utility managers a single platform for monitoring thousands of distribution transformers — detecting insulation degradation, oil contamination, and tap changer faults before they cause outages.
Week lead time for distribution transformers in 2025 — up from 12 weeks pre-pandemic — meaning a failed unit today takes over two years to replace under current supply constraints
60M+
Distribution transformers installed across the US grid — over 50% exceeding 33 years of service, placing more than 30 million units in the high-risk age bracket for insulation failure
39%
Of transmission and transformer outages caused by equipment failure — the single largest preventable category, exceeding environmental causes and human performance combined
$32B
Projected predictive maintenance market by 2030 — AI-driven transformer analytics is the fastest-growing segment as utilities shift from reactive to condition-based fleet management
The Real Problem With Distribution Transformer Management Is Not the Asset Age — It Is the Visibility Gap
Every utility knows its transformer fleet is aging. What most do not know — with precision — is which specific transformers are approaching failure, what type of fault is developing, and how much time remains before an outage event. The consequence of this visibility gap is not uniform. Some transformers fail catastrophically with no warning, causing extended outages, emergency procurement at premium pricing, and regulatory penalties. Others are replaced pre-emptively based on age alone — years before they actually need retirement, wasting capital that could have been deployed elsewhere in the grid.
Four Failure Modes of Reactive Transformer Management — and the Data That Prevents Each One
The Silent Degradation Problem
Insulation paper does not fail suddenly. It degrades over years — and without DGA data, that degradation is invisible until the transformer fails.
Cellulose insulation breakdown produces carbon monoxide and carbon dioxide at predictable rates based on temperature and moisture exposure. When monitored through regular DGA sampling, the rate of change in CO and CO2 concentrations provides a direct measurement of insulation paper remaining life. Without this data, utilities make replacement decisions based on calendar age — which correlates poorly with actual insulation condition. A 40-year-old transformer with conservative loading and low moisture content may have decades of remaining life, while a 25-year-old unit subjected to chronic overloading may be weeks from a catastrophic failure.
Invisible Insulation Aging
The Hot Spot Blind Spot
Overheating in transformer windings and core produces ethylene and hydrogen long before the temperature reaches a trip threshold.
Thermal faults are the most common precursor to transformer failure. A loose connection, degraded insulation between laminations, or blocked cooling channel creates a localised hot spot that accelerates oil breakdown and generates characteristic gases — primarily ethylene at moderate temperatures and acetylene at high-energy arcing temperatures. These gases dissolve in the oil and circulate throughout the tank, making them detectable at any sampling point. Continuous DGA monitoring detects the gas generation rate trend, distinguishing between stable background gassing and active fault progression that demands intervention.
Thermal Fault Escalation
The Tap Changer Failure Cascade
On-load tap changers are the most frequently failing transformer component — and their failure signature is clearly visible in DGA data weeks before mechanical breakdown.
Tap changers operate under load, switching between winding taps to regulate output voltage. Each operation produces a small arc that generates hydrogen and acetylene. When the tap changer contacts wear, the arc energy increases and gas production rises. When the switching mechanism begins to fail, the gas generation rate spikes — typically seven to fourteen days before a mechanical failure that locks the tap changer in position or causes a flashover. Continuous DGA monitoring with trend analysis detects this rate change and triggers an alert while there is still time to schedule maintenance during a planned outage.
Predictable Mechanical Failure
The Moisture Ingress Crisis
Moisture in transformer oil reduces dielectric strength by 50% or more — and it enters through seal failures that are invisible during visual inspection.
A 2025 Heathrow substation fire that caused a major airport blackout was attributed to moisture ingress in transformer insulation. Water in transformer oil accelerates cellulose degradation, reduces the oil's breakdown voltage, and creates a pathway for partial discharge activity that erodes insulation over months or years. The 2025 Chile blackout — the country's worst in 15 years — was triggered by a protection system failure cascading from equipment malfunction. Both events share a common root: conditions that could have been detected through systematic oil analysis and AI-patterned trend monitoring were invisible to operators relying on time-based inspection schedules.
Catastrophic Failure Trigger
AI Predictive Analytics · DGA Monitoring · Thermal Imaging · Fleet-Wide Transformer Health
Running Transformers to Failure Was a Tolerable Strategy When Replacements Took 12 Weeks. At 120 Weeks, It Is a Business Risk That No Utility Can Afford.
iFactory's transformer fleet analytics platform gives utility managers continuous visibility into every transformer's health status — with AI-powered DGA interpretation, thermal imaging integration, predictive failure scoring, and automated work order generation that transforms reactive maintenance into a systematic condition-based programme.
What iFactory's Transformer Fleet Analytics Module Actually Does
iFactory is not a DGA data logger with a basic dashboard. It is a unified transformer fleet analytics platform where every asset, every oil sample, every thermal image, and every maintenance event is registered, tracked, and analysed in a single data environment — with AI-driven pattern recognition that identifies developing faults across thousands of distribution transformers and prioritises intervention based on risk severity and criticality to grid operations.
Capability 01
AI-Powered DGA Interpretation — From Raw Gas Concentrations to Fault Diagnosis in Seconds
iFactory ingests DGA data from laboratory oil sample reports, online monitors, and portable analysers — then applies AI models trained on thousands of confirmed transformer fault cases to interpret gas concentrations and ratios using Duval Triangle, Rogers Ratio, and Key Gas methods simultaneously. The system cross-references results across all three diagnostic frameworks and produces a single consolidated fault diagnosis with confidence level — eliminating the interpretive variation that occurs when different engineers apply different standards to the same DGA data. Each diagnosis is linked to the raw gas concentrations, the calculated ratios, and the specific standard references that support it, creating an auditable decision trail for every transformer assessment.
Multi-standard DGA interpretation
AI-confirmed fault classification
Gas trend rate analysis
Capability 02
Thermal Imaging Integration — Detect Hot Spots Before They Become Winding Failures
iFactory integrates thermal imaging data from drone, handheld, and fixed camera inspections directly into each transformer's asset record. The AI compares thermal images against baseline operating profiles — accounting for load current, ambient temperature, and time of day — to identify anomalous temperature differentials that indicate developing faults. A top oil temperature that is 8 degrees above the expected value for the current load condition suggests a cooling system issue. A localized hotspot on a bushing suggests contamination or degradation. Each thermal anomaly is cross-referenced with concurrent DGA data to validate the diagnosis and automatically generates a work order for the appropriate corrective action.
Automated thermal anomaly detection
Load-compensated temperature analysis
Cross-sensor fault validation
Capability 03
Predictive Failure Scoring — Know Which Transformer Fails Next and How Much Time You Have
iFactory's predictive failure engine combines DGA trends, thermal data, load history, age, manufacturer, maintenance records, and environmental exposure into a single asset health score and failure probability curve for every transformer in the fleet. The AI model is trained on historical failure data — including the Doble transformer failure statistics database covering over 50,000 transformers and 3,800 confirmed failures — to identify the multi-variable patterns that precede different failure modes. Each transformer receives a health score from 0 to 100, a predicted remaining life window, and a ranked list of the most likely failure modes with the specific data points driving each prediction. Fleet-level scoring enables utility managers to prioritise interventions by risk rather than by calendar.
Multi-variable health scoring
Failure mode probability ranking
Risk-based intervention prioritisation
Capability 04
Fleet Health Dashboard — Every Transformer's Status in a Single Real-Time View Across the Distribution Grid
The fleet health dashboard aggregates condition data from every registered transformer in the distribution network. Utility managers see the distribution of health scores across the fleet, the count of transformers in each risk category, the trending of key fault gases across the network, and the list of assets requiring attention within the next seven and thirty days — all in a single configurable view. Any metric can be filtered by substation, voltage class, manufacturer, age range, or geographic region. When a transformer crosses a configurable health threshold, the system generates an alert with the specific data that triggered it and the recommended intervention timeline — enabling the shift from reactive outage response to proactive condition-based maintenance at fleet scale.
Real-time fleet health distribution
Risk-threshold escalation alerts
Geographic asset risk mapping
The DGA Gas Map — What Each Gas Tells You About the Health of Your Transformer
Dissolved gas analysis is the single most informative diagnostic tool available for oil-filled transformers. Each fault type produces a distinct gas signature, and the rate at which gas concentrations change is often more important than the absolute values. Understanding this gas map is the foundation of any transformer condition-based maintenance programme — and iFactory's AI interprets every gas ratio against IEEE and IEC standards automatically.
The Nine Critical Fault Gases in Distribution Transformer DGA — What They Mean and How iFactory Interprets Them
The most important gas for thermal fault assessment; rapid increase above 500 ppm indicates a severe hotspot requiring immediate attention
Generates high-priority alert when C2H4 exceeds trend threshold; cross-references with thermal imaging data for validation
Acetylene (C2H2)
High-energy arcing, tap changer contact wear, severe electrical faults
Any detectable acetylene is cause for concern; sustained levels above 10 ppm indicate active arcing that can lead to catastrophic failure
Immediate high-severity alert on any C2H2 detection; correlates with tap changer operation count to distinguish OLTC faults from winding arcing
Carbon Monoxide (CO)
Cellulose paper insulation degradation
CO-to-CO2 ratio below 0.1 indicates normal aging; ratio above 0.3 signals accelerated paper degradation that reduces transformer remaining life
Tracks CO-to-CO2 ratio trend over time; estimates remaining insulation life based on gas generation rate and loading history
Carbon Dioxide (CO2)
Cellulose degradation, oil oxidation, normal aging
CO2 is always present; the rate of increase above historical baseline indicates whether degradation is accelerating
Establishes transformer-specific CO2 baseline during first year of monitoring; alerts on sustained deviation from baseline rate
Oxygen (O2)
Seal integrity, air ingress through gasket or conservator system leaks
O2 above 10,000 ppm with rising trend indicates active air ingress that accelerates oil oxidation and paper degradation
Triggers seal integrity inspection work order when O2 exceeds threshold; cross-references with moisture level for comprehensive assessment
Moisture (H2O)
Seal degradation, breather desiccant exhaustion, paper insulation moisture content
Moisture above 30 ppm at 20 degrees Celsius significantly increases bubble evolution risk during overload events — a direct precursor to dielectric failure
Correlates moisture with temperature and load data to calculate bubble evolution risk; generates preventive drying work order before critical threshold is reached
We manage over 2,400 distribution transformers across a regional grid serving 1.1 million customers. Before iFactory, we operated a time-based maintenance programme — every transformer got an oil sample every two years, and we reviewed the results on a spreadsheet that was typically six weeks out of date. Our annual transformer failure rate averaged 3.2 percent, and each failure cost approximately $47,000 in emergency replacement and outage penalties. Eighteen months after deploying iFactory's transformer fleet analytics module, our failure rate dropped to 1.1 percent. The platform flagged a developing thermal fault on a 25 MVA substation transformer that our two-year sampling cycle would have missed for another fourteen months — a fault that, based on the gas generation rate, would have resulted in a catastrophic failure within six weeks of detection. That single prevented outage paid for the entire programme.
— Director of Grid Asset Management, Regional Electric Utility — 2,400 Distribution Transformers, 1.1 Million Customers
Conclusion
The global distribution transformer fleet is aging at a time when replacement lead times have stretched to over two years, costs have quadrupled, and grid demand is growing faster than at any point in recent history. Equipment failure accounts for 39 percent of transmission and transformer outages — the single largest preventable category. The utilities that continue running transformers to failure under a reactive replacement model face a compounding crisis: each failure costs more to remediate, takes longer to replace, and increases the risk of cascading grid events that compound across the network.
The alternative is a systematic, data-driven transformer fleet management programme built on continuous DGA monitoring, AI-powered fault interpretation, thermal imaging integration, and predictive health scoring — a programme that transforms the distribution transformer from a passive asset maintained on a calendar schedule to a monitored asset managed on the basis of its actual condition and risk profile.
iFactory's Transformer Fleet Analytics Module connects every asset, every oil sample, every thermal image, and every maintenance event into a single real-time health view — with AI-powered DGA interpretation, multi-sensor fault validation, predictive failure scoring, and the fleet dashboard that utility managers need to make good decisions before transformers fail. Book a Demo to see how the platform maps to your specific transformer fleet size and voltage class mix, or talk to an expert to begin your fleet health configuration and get your first transformer health dashboard live within thirty days.
Frequently Asked Questions
Periodic laboratory DGA sampling — typically performed annually or semi-annually — provides a snapshot of gas concentrations at a single point in time. It is cost-effective for large transformer fleets and adequate for stable, low-risk assets with no history of gassing. However, it misses the rate-of-change information that is often the most critical diagnostic indicator, and it cannot detect fast-developing faults that escalate between sampling intervals. Online continuous DGA monitoring provides real-time gas concentration data with hourly or daily resolution, enabling trend analysis that detects fault progression within days rather than months. iFactory supports both approaches within a single platform: continuous monitors on critical and high-risk transformers, periodic lab sampling for the balance of the fleet, and AI that integrates both data sources into a unified health assessment for every transformer. Talk to an expert to determine the right monitoring strategy for your transformer fleet size and risk profile.
iFactory's data ingestion layer supports DGA data from all major online monitor manufacturers — including Morgan Schaffer Calisto, GE Kelman, Serveron, Vaisala, and Qualitrol — as well as standardised laboratory data formats such as CSV, Excel, and ASTM D3612 report exports. The platform normalises gas concentration units, temperature corrections, and moisture calculations to a consistent standard across all data sources, so a utility managing transformers with monitors from three different manufacturers sees a unified gas concentration trend for each asset without manual reconciliation. The system also flags data quality issues — such as sampling errors, calibration drift, or inconsistent reporting formats — to ensure that AI-driven fault diagnosis is based on reliable input data. Book a Demo to see the data integration layer in action with your current monitor and laboratory data formats.
All transformers produce some level of background gas during normal operation. The challenge is distinguishing between stable background gassing and a developing fault. iFactory's AI establishes a transformer-specific gas generation baseline during the first six to twelve months of monitoring, accounting for load profile, age, manufacturer, and oil preservation system type. The system then applies rate-of-change analysis — tracking whether gas concentrations are increasing linearly, exponentially, or accelerating — combined with ratio-based fault diagnosis using Duval Triangle, Rogers Ratio, and Key Gas methods simultaneously. When the AI detects a gas generation rate that exceeds the transformer's established baseline by a statistically significant margin and the ratio analysis confirms a specific fault type, it generates an alert with the confidence level and the specific data points driving the diagnosis. This multi-layered approach reduces false alarms while ensuring that genuinely developing faults are identified early. Talk to an expert to review how the AI baseline calibration works for your specific transformer fleet demographics.
For a utility with 500 to 3,000 distribution transformers, iFactory's standard implementation sequence covers: weeks one to three for fleet register configuration and data ingestion setup, including connectivity with existing DGA monitors, laboratory data feeds, and CMMS integration; weeks four to six for historical data loading, baseline calibration, and AI model training on the specific transformer fleet demographics; weeks seven to eight for fleet health dashboard configuration, threshold setting, and escalation workflow design; and weeks nine to ten for team training and go-live. The baseline calibration period — during which the AI establishes transformer-specific normal gas generation profiles — typically requires six to twelve months of data for optimal accuracy, but actionable health scores and risk rankings are available from day one based on IEEE and IEC standard threshold comparisons plus the first available DGA data point. The first fleet health dashboard with risk-ranked transformer list is available within the first thirty days. Book a Demo to build the implementation timeline specific to your utility's transformer count, existing monitoring infrastructure, and current maintenance programme.
Waiting for Transformers to Fail Is No Longer a Maintenance Strategy. It Is a Grid Reliability Risk.
iFactory's Transformer Fleet Analytics Module — AI-powered DGA interpretation, thermal imaging integration, predictive health scoring, and fleet-wide condition dashboard. The single platform that transforms reactive transformer management into a systematic, data-driven, condition-based programme across your entire distribution grid.