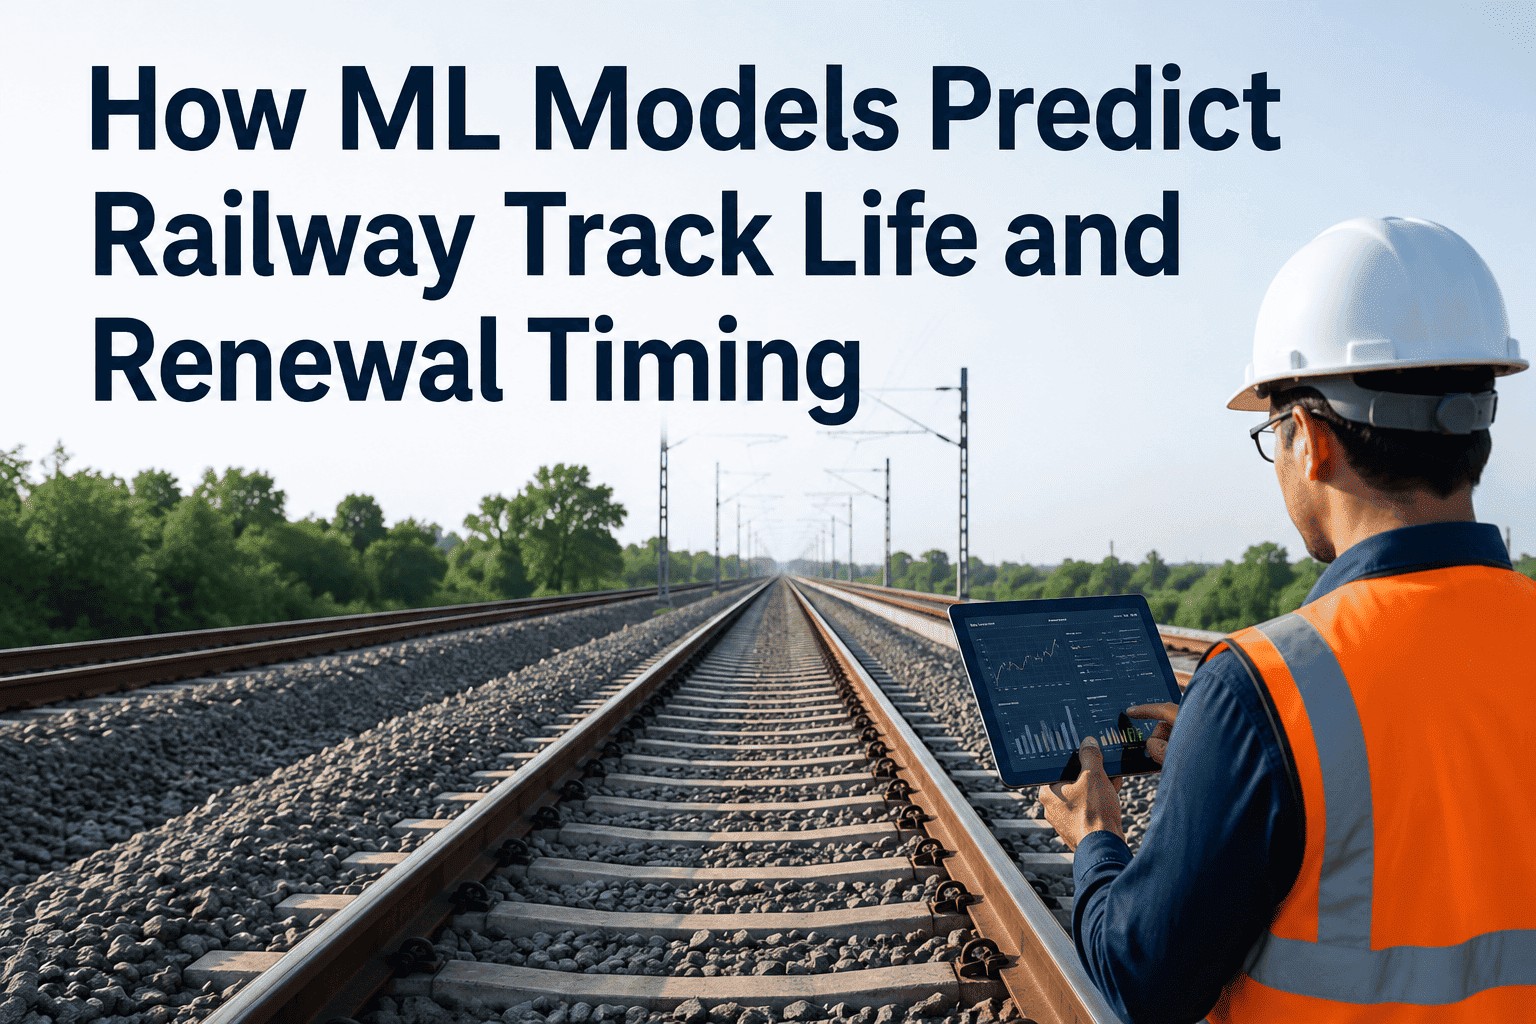
European railway networks allocate between $20 billion and $30 billion annually on track maintenance and renewal. The challenge isn't the scale of spending — it's the precision of timing. Renew track too early and capital is consumed before service life is exhausted. Renew too late and a tamping-restorable geometry failure becomes a full component replacement, three times more expensive and requiring a longer possession window. The asset management decisions that determine which outcome occurs — and the timetable they follow — have historically been made on fixed cycles, engineering judgement, and manual inspection readings. Machine learning changes the information available for those decisions entirely. By learning degradation curves from hundreds of track sections across varying load, climate, and geometry conditions, ML models can predict when each section will cross its tamping threshold, its renewal threshold, and its safe service limit — not based on when it was last renewed, but based on how it is actually deteriorating. This article covers how those models are built, what they need, and what renewal planning looks like when they are in use.
Degradation Modelling · Life Prediction · Renewal Timing · Capital Programme Optimisation
Stop Renewing Track on Fixed Cycles. Start Renewing It When the Data Says It's Time.
iFactory's railway ML platform builds segment-level degradation models that predict tamping and renewal thresholds for every section of your network — so capital programmes are built on actual remaining life, not scheduled replacement dates.
$20–30B
Annual European spend on track maintenance and renewal
3×
Higher cost of reactive renewal vs predictive intervention
18.1%
CAGR of railway AI market to 2029 — driven by predictive maintenance
20 yrs
Planning horizon ML models can forecast tamping and renewal needs within
The Three-Phase Track Degradation Problem ML Was Built to Solve
Track geometry degrades in three distinct phases after installation or renewal. Understanding which phase each section of your network is in — and how fast it is progressing — is the entire basis of optimal renewal planning. Fixed-cycle maintenance misses this entirely. ML models it at segment level.
Track Quality Index (TQI) Degradation Over Time — The Three Phases
Phase A
Post-Renewal Settling
Rapid initial settling of ballast after tamping or renewal. Degradation rate is highest immediately post-intervention then stabilises. Fixed-cycle models often mistake this as accelerated deterioration.
ML role: calibrate the settling curve — avoid premature re-tamping of recently renewed sections
Phase B
Slow Linear Degradation
The longest phase — steady, approximately linear deterioration at a rate determined by tonnage, axle loads, curve radius, and climate. This is where ML life prediction is most valuable: forecasting when Phase C begins.
ML role: model the degradation rate per section; project threshold-crossing dates 12–60 months ahead
Phase C
Exponential Acceleration
Degradation rate accelerates exponentially as component wear interacts: worn ballast reduces tamping effectiveness; worn rail profile increases dynamic forces which accelerate geometry loss. Tamping efficiency declines with each cycle until renewal is the only viable action.
ML role: identify transition into Phase C early — triggering renewal window before emergency intervention
Each section of track moves through these phases at a different rate depending on its specific loading, geometry, component condition, and climate exposure — which is exactly why fixed-cycle renewal intervals produce both premature and overdue interventions simultaneously across any large network.
What ML Models Need to Predict Track Life: The Input Variables
ML track life prediction models trained on a single variable — such as accumulated tonnage — produce unreliable outputs because track deterioration is driven by the interaction of many factors simultaneously. The most accurate models integrate five categories of input data, with SHAP analysis consistently identifying the highest-importance features across different network types.
Input Category 01
Track Geometry Measurement History
Time-series records of standard deviation values for longitudinal level, twist, alignment, and gauge from inspection runs. The rate of change between measurement cycles is as important as the absolute value — ML uses the velocity and acceleration of degradation to project future condition.
Longitudinal level SD
Twist and alignment SD
Track Quality Index (TQI)
Degradation rate between runs
Input Category 02
Loading and Traffic Data
Accumulated tonnage (MGT), axle load distribution, train speed, and traffic mix (passenger vs freight ratio) drive the mechanical wear on rail, sleepers, and ballast simultaneously. ML models trained with high-resolution traffic data consistently outperform tonnage-only models by capturing the non-linear interaction between axle load and speed on component wear rates.
Accumulated tonnage (MGT)
Maximum axle load
Passenger/freight traffic split
Line speed and braking frequency
Input Category 03
Track Geometry and Component Characteristics
Curve radius and cant deficiency, gradient, sleeper type and spacing, ballast depth and condition, rail section weight and steel grade, and fastener type. Tight-radius curves and steep gradients are consistently the highest-importance static features in SHAP analysis across published ML track life studies — they amplify the effect of every other degradation driver.
Curve radius and cant
Gradient and vertical alignment
Sleeper type, spacing, condition
Rail section weight and grade
Input Category 04
Environmental and Climate Data
Temperature extremes, frost penetration depth, rainfall and drainage adequacy, and ground movement from seasonal moisture variation. The ScienceDirect ML track lifetime study (2025) identified environmental and climate factors as key degradation variables through permutation and SHAP analysis — particularly on sections with poor subgrade drainage where freeze-thaw cycles destabilise ballast.
Frost index and freeze-thaw cycles
Annual rainfall and drainage rating
Temperature range extremes
Subgrade soil type and stability
Input Category 05
Maintenance Intervention History
The date, type, and effectiveness of each previous tamping, grinding, sleeper renewal, and ballast cleaning intervention. ML models use intervention history in two ways: to understand the remaining effectiveness of the current asset state (how much life remains in the post-last-tamping condition), and to model the declining tamping effectiveness that signals the approach of the Phase B-to-C transition. The Wiley data-driven maintenance framework (2022) identifies this as the most predictive input variable for short-to-medium term tamping threshold prediction.
Date and type of last tamping
Number of tamping cycles to date
Rail grinding and profile records
Ballast cleaning and drainage works
The ML Algorithms Applied to Track Life Prediction
Multiple ML approaches have been validated on track degradation problems. The choice of algorithm depends on the prediction task — short-term tamping threshold, medium-term renewal window, or long-term lifecycle planning — and the quality and volume of available historical data.
XGBoost / Random Forest
Ensemble Methods
Best for: Threshold crossing prediction with high feature importance interpretability
The 2025 ScienceDirect track lifetime study used CatBoost, Random Forest, and XGBoost with Bayesian optimisation — achieving superior accuracy by combining ensemble generalisation with SHAP-based feature importance analysis. These methods handle the mixed variable types (static geometry + dynamic time series) and missing data patterns common in maintenance records particularly well.
Transformer + Ensemble
Deep Learning
Best for: Short-term degradation prediction on heterogeneous track sections
The 2025 Wiley Computer-Aided Civil and Infrastructure Engineering study deployed an ensemble Transformer model — using unsupervised learning to group track sections by degradation behaviour, then applying the Transformer's sequence modelling capability to handle the irregular time intervals between inspection runs that make conventional time-series models less accurate on actual track data.
Graph Convolutional Networks
GCN
Best for: Network-wide prescriptive maintenance scheduling with spatial dependencies
Published in the Decision Analytics Journal (March 2025), a GCN framework uses the geographic and topological relationships between track sections to improve prediction accuracy — recognising that adjacent sections on a shared subgrade often degrade in correlated patterns. The GCN outputs maintenance schedules that minimise network-wide downtime, not just section-level tamping thresholds.
Stochastic / Weibull Models
Probabilistic
Best for: Long-term lifecycle costing and renewal programme planning under uncertainty
Weibull survival models combined with ML-derived degradation rate inputs produce probability distributions for remaining service life — giving infrastructure managers the P10/P50/P90 renewal horizon they need to build multi-year capital programmes. The combination of ML short-term accuracy and Weibull long-term probabilistic framing is the approach most commonly used for 10–20 year renewal planning in European infrastructure authorities.
Degradation Curves · Tamping Threshold · Renewal Window · Capital Programme
How Many Sections on Your Network Are Approaching Phase C Without You Knowing?
iFactory's ML platform builds degradation models for every section of your track network — identifying which sections are approaching tamping and renewal thresholds, and when intervention is most cost-effective. Book a Demo to run the degradation model on your inspection data.
From ML Predictions to Capital Programme: How the Output Is Used
ML degradation predictions are only as valuable as the planning decisions they inform. The model output translates into three specific planning deliverables that change how infrastructure managers build annual maintenance programmes and multi-year capital investment plans.
Planning Output 01
Tamping Priority Queue — Next 12 Months
A ranked list of all sections projected to exceed the intervention threshold within the coming 12 months, with projected breach date and estimated tonnage at breach. Used to build the annual tamping programme, sequence possessions to minimise service disruption, and cluster nearby sections to reduce possession overhead costs.
Planning Output 02
Renewal Window Forecast — 3–10 Year Horizon
Renewal Window Forecast — 3–10 Year Horizon
Sections projected to exhaust tamping effectiveness and require renewal within the medium-term planning horizon, with cost estimates at the predicted renewal date versus early intervention. This output directly feeds the 5-year capital investment programme and informs budget submissions to governing bodies. The Wiley data-driven framework (2022) implements exactly this as its tactical planning level — combining degradation prediction with maintenance intervention timing optimisation.
Planning Output 03
Lifecycle Cost Optimisation — 20-Year Network View
Probabilistic lifecycle cost curves for the full network under different maintenance strategies — showing the cost of each renewal timing decision compounded over 20 years. Research on probabilistic degradation models demonstrates that optimising the renewal trigger threshold reduces 20-year lifecycle costs non-linearly: the optimal intervention point exists at a specific condition level, and departures in either direction (too early or too late) increase whole-of-life cost significantly.
Fixed-Cycle Renewal vs ML-Driven Renewal: The Planning Difference
The shift from fixed-cycle to ML-driven renewal planning changes outcomes at every level — from the individual maintenance decision to the multi-year capital programme.
| Planning Dimension |
Fixed-Cycle Approach |
ML-Driven Approach |
| Renewal Trigger |
Calendar age or tonnage threshold — same for all sections |
Predicted condition threshold — specific to each section's actual degradation rate |
| Tamping Frequency |
Fixed interval — regardless of actual condition |
Condition-based — triggered when ML projects threshold breach within planning window |
| Identification of At-Risk Sections |
Reactive — identified when failure or rapid deterioration is observed |
Proactive — 12–60 months advance warning on sections approaching thresholds |
| Capital Programme Basis |
Age-based renewal schedule and historical budget trends |
Condition-projected renewal demand by year, with lifecycle cost optimisation |
| Intervention Grouping |
Manual — planner combines nearby works where possible |
Algorithmic — ML identifies sections that will breach within the same window and can be combined in a single possession |
| Whole-Life Cost |
Sub-optimal — some sections renewed early, others late relative to cost-optimum |
Optimised against lifecycle cost function — intervention triggered at the condition point that minimises 20-year total spend |
"
Before the ML model, our 5-year capital programme was essentially a rolling list of sections approaching their age-based renewal dates, adjusted by what we could afford. It was a budget exercise, not a condition exercise. The ML output showed us that 23% of our planned renewals in the first year were on sections with a predicted remaining life of at least three more years — and that eight sections not on the programme at all were projecting to fail within 18 months. We restructured the entire programme. The capital saving in year one was enough to fund two additional renewal projects that had been deferred for budget reasons.
— Asset Strategy Manager, National Rail Infrastructure Authority — 21 Years Track Engineering and Capital Planning Experience
Conclusion
Machine learning track life prediction is not a monitoring upgrade — it is a capital allocation tool. Fixed-cycle renewal programmes systematically misallocate budget by treating all track equally, regardless of actual condition. ML models built on inspection history, loading data, geometry characteristics, climate inputs, and maintenance records produce segment-level degradation curves that identify the sections approaching threshold crossing, the optimal timing for cost-effective intervention, and the whole-network renewal demand by year over a 10–20 year horizon. The infrastructure managers deploying these models are restructuring capital programmes that had been running on engineering convention for decades — and finding both premature renewals they can defer and deferred renewals that are genuinely urgent.
iFactory's railway ML platform builds degradation models from your existing inspection and maintenance data, producing segment-level life predictions, tamping priority queues, and renewal horizon forecasts for your capital programme. Book a Demo to run the degradation model on your inspection dataset, or Get In Touch to begin the data onboarding process.
Frequently Asked Questions
Every section of track is telling you when it needs renewing. The question is whether you're reading the data — or following a calendar.
iFactory's ML platform builds degradation curves for your entire track network — identifying the tamping and renewal timing that minimises 20-year lifecycle cost, section by section. Book a Demo or sign up to run the model on your inspection data.