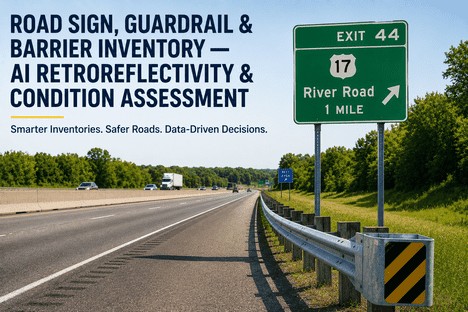
The United States highway network spans 4.2 million miles, lined with an estimated 150 million traffic signs, 30 million guardrail segments, and countless barrier systems that together form the roadside safety infrastructure protecting every driver on the road. Every one of these assets has a compliance requirement, a degradation curve, and a replacement cost. The Manual on Uniform Traffic Control Devices mandates that all permanent traffic signs meet minimum retroreflectivity levels — yet most asset managers cannot tell you which signs in their inventory are below those thresholds at any given time. Guardrail terminals that have been damaged in unreported incidents remain in place until the next scheduled inspection, and a barrier section that has lost its crashworthiness goes undetected for months. The agencies that consistently pass compliance audits, minimise liability exposure, and optimise replacement budgets have one operational advantage in common: they have replaced manual, schedule-based inspections with AI-powered condition assessment that continuously evaluates every sign, guardrail, and barrier against current standards. This is the asset manager's guide to deploying it.
The Asset Managers Who Pass MUTCD Compliance Audits and Reduce Replacement Spend by 40% Have One Thing in Common: Their Asset Condition Data Is Collected Automatically, Not By Night Crews With Handheld Meters.
iFactory's AI-powered roadside asset management platform gives asset managers automated condition assessment for every sign, guardrail, and barrier in the network — with MUTCD retroreflectivity compliance scoring, damage detection, replacement priority ranking, and audit-ready inventory records generated from standard survey vehicle video footage. Deployed by state DOTs and county road departments managing networks from 500 to 500,000 assets.
Traffic signs installed across the US highway network — the majority of which have never been assessed for retroreflectivity compliance against current MUTCD minimum standards
3x
Nighttime fatal crash rate compared to daytime — the safety gap that retroreflectivity standards are designed to close through maintained sign visibility
40%
Potential reduction in sign and guardrail replacement spend when AI condition assessment replaces blanket replacement programmes with targeted, priority-ranked asset interventions
90%
Cost reduction versus manual field inspections when AI-powered image analysis replaces boots-on-the-ground surveys for network-wide asset inventory and condition data
6-12
Months needed for a field crew to complete a full manual sign inventory on a typical state highway network — data that is partially outdated by the time it is delivered
The Core Problem in Roadside Asset Management: Why Manual Inspection Cannot Meet Compliance or Budget Requirements
An asset manager responsible for 50,000 traffic signs across a state highway network faces an impossible equation. The MUTCD requires that every sign be maintained above minimum retroreflectivity levels — but there is no practical way to manually inspect 50,000 signs at the frequency needed to ensure compliance. The standard compliance methods available to agencies are all resource-constrained: visual nighttime inspections require experienced crews working overnight hours on active roadways, measured retroreflectivity with handheld meters requires stopping at every signpost, expected life methods rely on manufacturer data that does not account for local UV exposure and environmental degradation, and blanket replacement programmes replace signs before the end of their useful life, wasting budget on assets that could have served for years longer. The same dynamic applies to guardrails and barriers — damage from unreported collisions, corrosion, and environmental degradation accumulates between inspection cycles, and the asset manager does not know the condition of any individual barrier section until a crew visits it in person. The consequence is a roadside asset programme that is simultaneously non-compliant, over-budget, and under-informed.
Control SignsLimited sample, misses local variation
Three Guardrail Assessment Gaps
Unreported Collision DamageRemains in place until next manual inspection
Corrosion & Environmental DegradationVaries dramatically by microclimate — salt zones worse
Terminal & Connection ConditionMissing bolts and anchorage failure invisible from roadway
The Cost of Manual Compliance: What Asset Managers Actually Spend
$28-45
Per sign — manual retroreflectivity field measurement
Stop-at-every-post handheld measurement: labor, travel, traffic control, and data entry for a single sign assessment
$800-2,000
Per lane-mile — traditional sign and guardrail inventory survey
Specialised survey vehicle with LiDAR plus manual data processing and QA validation for network-level asset collection
$80-200
Per lane-mile — AI-powered asset condition assessment from standard video
Automated sign detection, retroreflectivity estimation, guardrail damage scoring, and barrier compliance check from existing dashcam or survey vehicle footage
The Four Asset Categories Where AI Condition Assessment Eliminates Compliance and Budget Risk
01
Traffic Sign Retroreflectivity Compliance
The MUTCD requires agencies to maintain minimum retroreflectivity levels for all permanent signs using one of five approved methods. In practice, most agencies rely on blanket replacement schedules or expected life tables because the alternatives are too resource-intensive. AI-powered retroreflectivity assessment from standard survey video eliminates this trade-off: the system analyses sign appearance against known sheeting material degradation curves and assigns a compliance status — pass, monitor, or replace — for every sign in the network. The asset manager receives a complete compliance report without dispatching a single night crew or buying a handheld meter.
AI fix: Network-wide retroreflectivity compliance status from standard video. No night inspections, no handheld meters, no blanket replacements.
02
Guardrail Damage Detection and Condition Scoring
Guardrails are damaged in collisions that drivers frequently do not report. The damage — face dents, deformed end terminals, compromised support posts, missing splice bolts — remains in place until the next scheduled inspection, which may be months away. During that interval, the guardrail segment cannot perform its intended safety function. AI condition assessment from video imagery detects and classifies guardrail damage by severity: face deformation, terminal damage or displacement, support deficiency, and connection failure. Each guardrail segment receives a condition score — good, fair, poor, critical — and a recommended repair timeframe. Asset managers see which segments need immediate attention without field verification.
AI fix: Per-segment guardrail condition score with damage classification. Critical findings dispatched for repair within hours of detection.
03
Barrier System Inventory and Compliance Verification
Concrete barriers, cable barriers, and water-filled barriers each have specific installation, connection, and maintenance requirements that affect crashworthiness. Many agencies do not have a complete inventory of their barrier systems — what type is installed where, in what condition, and whether it meets current MASH standards. AI assessment identifies barrier type, location, and visible condition from survey video. Missing connections, displacement, spalling, and barrier end treatment issues are flagged automatically. The resulting inventory gives the asset manager, for the first time, a complete picture of every barrier asset in the network with condition data attached.
AI fix: Complete barrier inventory with type classification and condition flags. MASH compliance gaps identified at network scale.
04
Replacement Priority and Capital Planning
The condition data from all three asset categories feeds into a unified replacement priority model. Every sign, guardrail segment, and barrier section is ranked by condition severity, safety criticality (stop signs and curve warning signs ranked above guide signs), traffic exposure, and time since last replacement. The asset manager sees a single ranked list: replace these first, monitor these, defer these. Capital replacement budget is allocated to the assets that pose the highest safety risk, not the assets that happen to be the oldest on the inventory spreadsheet. The model updates automatically as new condition data arrives.
AI fix: Unified replacement priority across all roadside asset classes. Budget allocated by risk, not by age.
Manual Inspection
Night crews with handheld meters. Stop-at-every-post surveys. Subjective visual ratings. 6-12 month update cycles. Blanket replacement programmes. Spreadsheet-based inventory. Compliance gaps discovered during audits. Liability exposure from undetected damage.
AI-Powered Assessment
Automated retroreflectivity compliance from standard video. Per-sign condition status. Per-segment guardrail damage scoring. Continuous network-wide monitoring. Priority-ranked replacement lists. GIS-connected asset registry. Audit-ready compliance records. Replacement spend allocated by risk.
When Sign and Guardrail Condition Is Assessed Manually, the Asset Manager Is Always Months Behind the Actual State of the Network. AI Assessment Closes the Gap Between Inspection Cycles.
iFactory builds continuous condition assessment directly into the asset management workflow — so asset managers know the compliance status and replacement priority of every sign, guardrail, and barrier in the network without dispatching a single field crew.
The iFactory AI Condition Assessment Platform: Three Capabilities for Roadside Asset Management
The iFactory AI condition assessment platform operates as a three-capability system for roadside asset management — automated detection and classification at the asset level, condition scoring and compliance verification at the evaluation level, and replacement priority and audit documentation at the programme level. Each capability serves a different asset management function, and all three run on standard survey vehicle or dashcam video footage without requiring specialised sensor vehicles.
Capability 01
Automated Asset Detection & Classification
Every sign, guardrail, and barrier identified and classified from standard roadway video
The detection layer uses a computer vision model trained on millions of roadside asset images to identify and classify every sign, guardrail segment, and barrier in the video feed. For signs, the model recognises regulatory (stop, yield, speed limit), warning (curve, intersection, pedestrian), and guide (destination, route marker) categories — and reads the sign legend where legible. For guardrails, the model identifies the start and end of each continuous segment and classifies the terminal type. For barriers, it distinguishes concrete, cable, steel, and water-filled types. Every detection is georeferenced to the vehicle GPS track and logged with a timestamp, image frame reference, and confidence score. The asset manager receives a complete, GIS-connected inventory of every roadside asset in the surveyed network — built from a single drive of each route.
Sign type classification
Guardrail segment detection
Barrier type identification
Capability 02
Condition Scoring & Compliance Verification
Per-asset condition grade with MUTCD compliance status and damage classification
The condition assessment layer evaluates each detected asset against standard condition criteria. For signs, the model estimates retroreflectivity compliance status by analysing sheeting appearance against known degradation curves for the identified sheeting type — engineer grade, high intensity, or diamond grade. Each sign receives a compliance classification: pass (above minimum), monitor (approaching threshold), or replace (below minimum). For guardrails, the model detects and scores face dents, terminal deformation, support displacement, and missing connections on a severity scale. For barriers, the model identifies spalling, displacement, connection failures, and end treatment condition. The asset manager sees a condition score for every individual asset — good, fair, poor, or critical — with the specific defect type and severity documented.
Retroreflectivity compliance
Guardrail damage scoring
Barrier defect detection
Capability 03
Replacement Priority & Audit Documentation
Condition-based replacement ranking and MUTCD compliance records generated automatically
The replacement priority engine ranks every asset by a composite score that combines condition severity, safety criticality, traffic exposure, and time since last replacement. The asset manager receives a single ranked list per asset category: which signs to replace first, which guardrail segments need immediate repair, which barrier sections present the highest safety risk. The audit documentation module generates MUTCD compliance records for every sign in the inventory — showing the assessment date, method used, compliance status, and next scheduled reassessment. For agencies subject to FHWA compliance review or HSIP safety programme requirements, the documentation demonstrates that a systematic, documented assessment method is in place and that replacement decisions are driven by condition data rather than schedule or complaint volume.
Risk-ranked replacement lists
MUTCD compliance records
HSIP programme documentation
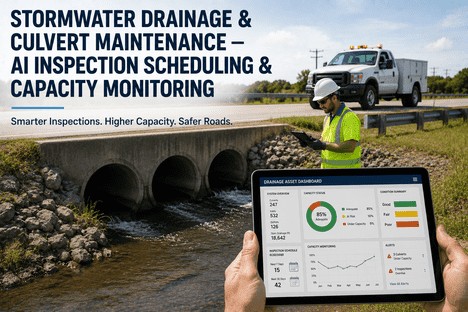
What the Roadside Asset Dashboard Shows the Asset Manager
The asset manager's view of the iFactory AI condition assessment platform is not a video playback tool — it is an asset programme management system. The dashboard is designed around the questions that asset managers need to answer every day: Is my sign inventory in MUTCD compliance across every route? Which guardrail segments are damaged and where are they located? Which assets need replacement first based on actual condition, not installation date? And when the compliance audit arrives, is the documentation ready to present?
Asset View 01
Sign Inventory — Compliance Status by Route and Sign Type
Every detected sign is plotted on the network map with a compliance status indicator — green for pass, yellow for monitor, red for replace. The asset manager filters by sign type (stop signs, speed limits, warning, guide), route, or jurisdiction to see compliance concentration. A compliance summary bar shows the percentage of the sign inventory in each status category, network-wide and by route. Any sign flagged as replace includes the estimated retroreflectivity level and the recommended replacement sheeting grade.
Manager action: Export compliance report by route. Prioritise replace-status signs in highest-traffic corridors first.
Asset View 02
Guardrail Condition Map — Damage Type and Severity
Guardrail segments are displayed on the map colour-coded by condition score. Clicking any segment opens the damage detail: face dent depth classification, end terminal condition, support post status, and any detected connection anomalies. The damage detail includes the image frame where the damage was detected for visual verification. Asset managers see which segments have critical damage requiring immediate repair, which have moderate damage that can be scheduled, and which are in good condition. Historical comparison shows whether damage is accumulating or stable.
Manager action: Critical-severity segments trigger work order. Moderate-severity grouped into repair routes by geographic proximity.
Asset View 03
Barrier System Register with MASH Compliance Flags
Every concrete barrier, cable barrier, and steel barrier section is registered by type, location, length, and end treatment configuration. Barriers that do not meet current MASH standards are flagged automatically. The asset manager sees the full barrier inventory for the first time — including barriers installed by third parties or during construction projects that may not have been entered into the asset management system. Condition flags identify spalling, displacement, connection failures, and missing delineation.
Manager action: MASH compliance gaps documented for capital programme. Non-compliant barriers prioritised for upgrade funding requests.
Asset View 04
Replacement Priority — Unified Ranking Across All Asset Classes
The unified replacement priority view shows a single ranked list combining signs, guardrails, and barriers sorted by composite risk score. The asset manager sees the top 50 assets requiring action across the entire network regardless of asset type. Each entry shows the asset location, condition score, safety criticality, traffic exposure, and estimated replacement cost. The prioritisation model can be configured to weight safety criticality above condition severity or to prioritise specific asset classes. Budget scenarios can be run — what-if analysis shows how many critical assets would remain unaddressed at different funding levels.
Manager action: Ranked replacement list drives capital budget requests. Scenario analysis justifies funding requests with asset-level data.
Asset View 05
Compliance Audit Package — MUTCD Records in One Export
Every compliance record required for a MUTCD audit is generated automatically: the assessment method documentation, the inventory of assessed signs with compliance status for each, the replacement records for signs that have been changed out, and the schedule for the next assessment cycle. The audit package is searchable by route, sign type, date range, or compliance status. For asset managers preparing for FHWA compliance review or defending against liability claims, the audit package demonstrates that a systematic assessment programme is in place and that every sign in the inventory has been evaluated within the required timeframe.
Manager action: Export full audit package on demand. Demonstrate systematic compliance programme to auditors and legal counsel.
Asset View 06
Trend Analysis — Condition Trajectory by Asset Class and Zone
The trend analysis view tracks condition trajectory over successive assessment cycles. Asset managers see whether the overall condition of the sign inventory is improving, holding steady, or declining — and which routes or zones are driving the trend. For guardrails, the trend view shows whether collision damage is concentrated in特定 corridors, supporting targeted safety countermeasure deployment. For barriers, the condition trajectory informs the capital replacement schedule: barriers that are declining faster than the network average are candidates for earlier replacement or upgraded materials.
Manager action: Declining condition trend on specific route triggers investigation. Countermeasure budget allocated to zones with fastest degradation rate.
Our sign compliance programme had relied on blanket replacement every ten years and whatever nighttime visual inspections our stretched crew could complete between snow seasons. We knew the approach was leaving gaps, but we had no way to quantify the risk across 85,000 signs. The AI condition assessment platform gave us something we had never had: actual compliance status for every sign in the inventory. In the first survey, we found that 14% of our regulatory signs — stop signs, speed limits, do not enters — were below minimum retroreflectivity levels. Eight percent of our guardrail segments had damage that required repair, including three end terminals that would not have performed in a crash. Our replacement budget, which had been spread evenly across the network by asset age, was reallocated to the highest-risk assets. The first year audit passed with no findings. The replacement spend dropped 37% because we stopped replacing signs that were still meeting standards.
— Asset Management Engineer, State Department of Transportation — 85,000 Signs, 4,200 Guardrail Segments, 1,800 Barrier Sections
Conclusion
Roadside asset management improvement is not a budget problem or a staffing problem — it is a data visibility problem. When the only way to assess sign retroreflectivity is a night crew with a handheld meter, when guardrail damage goes undetected until the next inspection cycle, when barrier inventory is incomplete and condition is unknown, and when replacement budget is allocated by age rather than risk, the asset programme is simultaneously spending too much and leaving compliance gaps that create liability. AI-powered condition assessment from standard roadway video addresses all four dimensions simultaneously: network-wide retroreflectivity compliance without field crew deployment, per-segment guardrail damage detection between inspection cycles, complete barrier inventory with condition data, and risk-ranked replacement priority that allocates every dollar to the asset that needs it most.
The evidence across state DOT asset management programmes in 2025 and 2026 is clear: agencies deploying AI-powered condition assessment are reducing replacement spend by 35 to 40% by replacing only assets that are genuinely below standard, cutting inventory survey costs by 80 to 90% compared to manual field methods, and passing MUTCD compliance audits with documented, systematic assessment programmes. The asset managers achieving these results are the ones who deployed automated condition assessment early, integrated sign, guardrail, and barrier data into a single asset management platform, and used the replacement priority ranking to convert condition data into capital budget justifications that demonstrate clear safety and compliance return on every dollar requested.
iFactory's AI roadside asset management platform is designed for asset managers at state DOTs, county road departments, and municipal public works agencies who need to achieve MUTCD compliance, reduce replacement spend, and eliminate condition blind spots simultaneously. Book a Demo to see the AI condition assessment platform configured for your sign, guardrail, and barrier inventory, or talk to an expert about a free roadside asset compliance assessment and condition audit for your network.
Frequently Asked Questions
The MUTCD specifies five approved methods for maintaining sign retroreflectivity compliance: visual nighttime inspection, measured retroreflectivity, expected life, blanket replacement, and control signs. AI-powered retroreflectivity assessment from video imagery does not replace these methods — it automates them. The AI model estimates retroreflectivity by analysing sign appearance against known degradation curves calibrated to the sheeting material type identified in the image, operating within the measured retroreflectivity framework. The output is a compliance classification per sign that directly supports the documented assessment programme the MUTCD requires. Agencies using AI assessment typically pair it with periodic spot-check measured retroreflectivity sampling to validate the model output — the same quality assurance approach used for any large-scale assessment method. For audit purposes, the AI assessment provides a complete, documented inventory with per-sign compliance status that demonstrates a systematic assessment programme is in place and operational. Talk to an expert about how the AI assessment method fits within your agency's MUTCD compliance programme documentation.
The system processes standard forward-facing video footage captured by any vehicle driving the road network at normal traffic speed. The minimum requirements are 1080p resolution video at 30 frames per second with GPS track data synchronised to the video stream. The platform accepts footage from dashboard cameras already installed in fleet vehicles, dedicated survey vehicle cameras, or mobile device cameras mounted on the windshield. Many agencies already collect video data for other purposes — pavement condition surveys, winter maintenance documentation, or construction progress monitoring — and the sign, guardrail, and barrier assessment can be run against that existing footage without additional data collection drives. The platform processes the video footage and returns the asset inventory, condition assessment, and compliance report — the asset manager does not need to operate any specialised equipment or modify existing fleet vehicles. Book a Demo to see the processing pipeline applied to sample footage from your fleet vehicles.
The damage detection model is trained on each guardrail type separately with defect typologies specific to that type. For W-beam guardrails, the model detects face dents and deformations, end terminal damage or displacement, support post deflection or missing posts, and missing or loose splice bolts between segments. For cable barriers, the model detects cable sag, broken cables, missing or damaged anchorages, and terminal displacement. For concrete barriers, the model detects spalling, cracking, joint displacement, and damage to end treatments. Each defect type is classified by severity level — minor, moderate, severe — with the estimated repair action and urgency. The model also identifies environmental factors that accelerate degradation, including corrosion staining in salt-zone installations and vegetation overgrowth that compromises barrier visibility and clearance. The detection confidence and the image frame showing the defect are recorded with each finding, allowing the asset manager to verify the assessment visually before dispatching a repair crew. Talk to an expert about configuring the guardrail damage detection model for the guardrail types in your network inventory.
The replacement priority model generates output that maps directly into standard capital planning and budget workflows. The ranked asset list is exportable in formats compatible with agency financial management systems, GIS platforms, and CMMS work order systems. The asset manager can run budget scenario modelling: what is the cost to address all critical-severity assets this year versus a three-year rollout? How many assets in the replace category can be addressed at different funding levels? Which routes have the highest concentration of below-standard signs or damaged guardrails? The model output provides the per-asset justification that supports capital budget requests — each dollar requested is linked to a specific asset with documented condition data, safety criticality, and compliance status. For HSIP funding applications, the model output provides the safety benefit-cost basis that grant programmes require, with documented condition data as evidence of need. Book a Demo to see budget scenario modelling applied to your asset inventory data.
A Sign That Has Lost Its Retroreflectivity Is a Safety System That Has Failed — And No One Knows Until the Audit or the Crash. Get a Free Compliance Assessment.
iFactory's AI roadside asset management platform for DOT and public works asset managers — automated sign retroreflectivity compliance, guardrail damage detection, barrier condition assessment, and risk-ranked replacement priority generated from standard roadway video footage your fleet already produces.