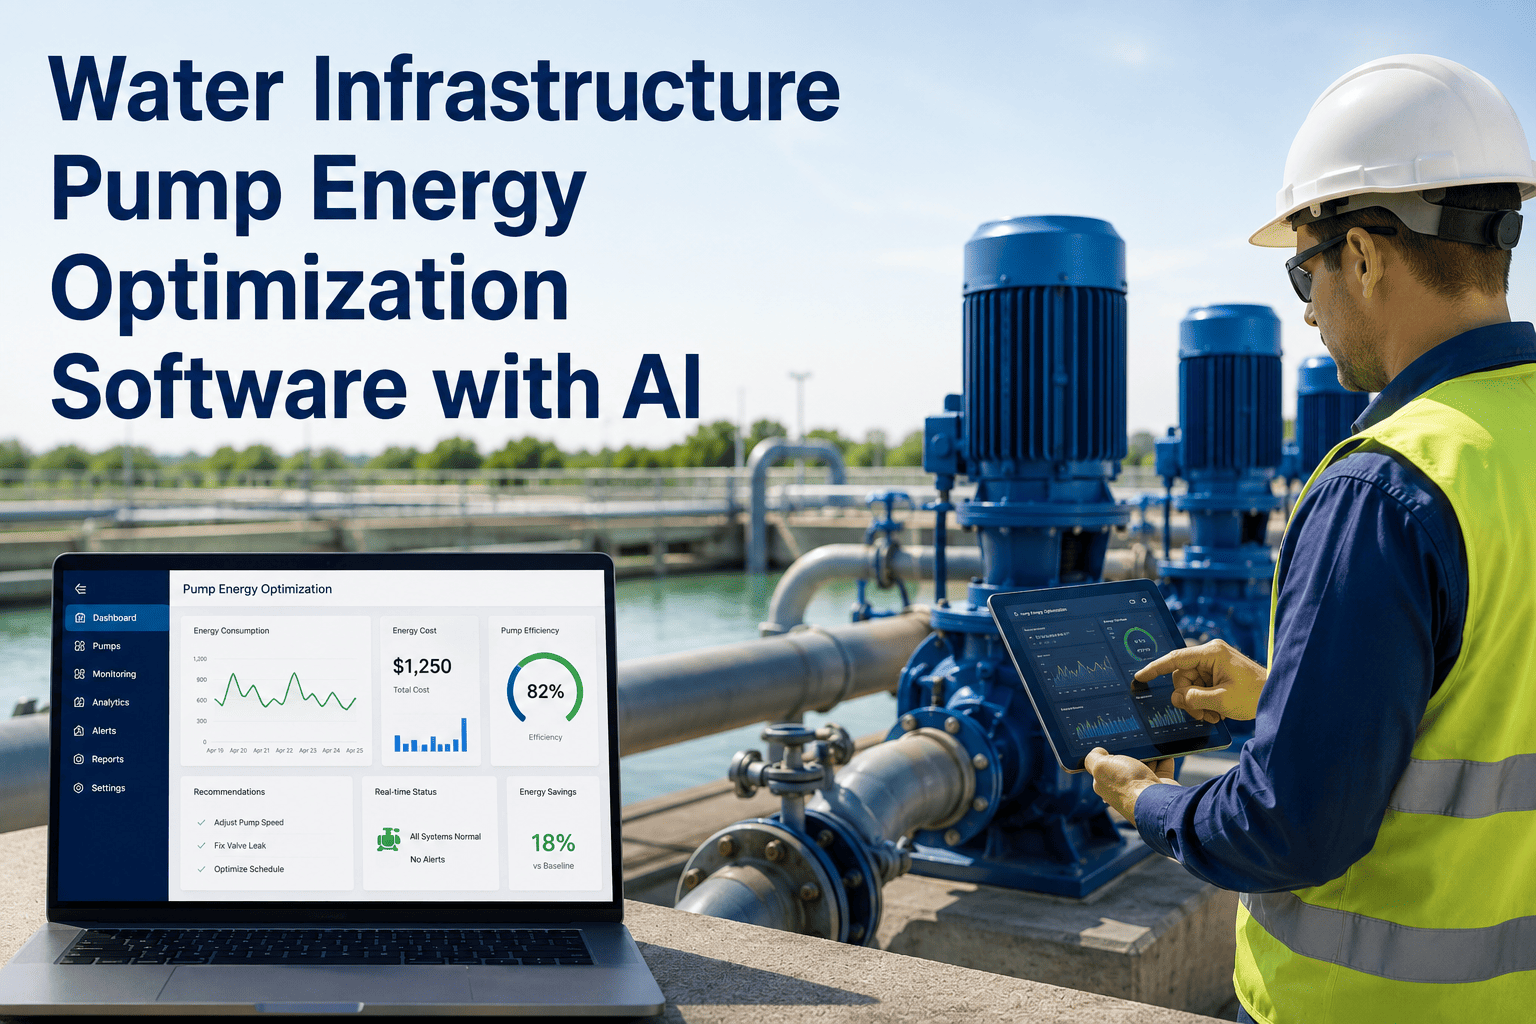
Every water utility knows pumping is the largest line item on the power bill, yet most plants still schedule pumps the same way they did twenty years ago: run the biggest unit, chase tank levels, and hope the peak-hour tariff doesn't hit while three pumps are running at once. The gap between what a pump station could cost to run and what it actually costs rarely shows up until someone finally compares kWh against flow delivered, and by then months of avoidable spend are already gone. See how iFactory turns raw SCADA and tariff data into a live optimization engine at ifactory support.
Cut Pumping Energy Costs Without Touching a Single Valve
AI-driven demand forecasting, pump scheduling, and asset performance analytics that tell your pump station exactly which units to run, when to run them, and when a bearing is about to cost you more than the electricity ever will.
Why Pumping Quietly Became Your Biggest Controllable Cost
Water and wastewater utilities do not choose to spend heavily on energy, they inherit it. Pumps move water uphill, across pressure zones, and against friction losses that never show up on a design drawing the way they show up on an electricity invoice. Because pumping is unavoidable, most plants stopped questioning it years ago and started treating the power bill as a fixed cost of doing business. That assumption is exactly what is now costing utilities the most, because pump energy is one of the few genuinely controllable costs on the entire balance sheet. The pumps themselves are not the problem. The problem is that they are almost always scheduled reactively, run at whatever speed keeps a tank from running dry, with no connection to what electricity actually costs at that exact hour or which unit on site is running closest to its best efficiency point.
Where the Waste Is Actually Hiding Inside a Pump Station
A pump station rarely fails all at once. It bleeds efficiency in small, compounding ways across four predictable points, and because each one looks minor on its own, none of them individually trigger an investigation. The diagram below breaks down where a typical station loses the most recoverable energy, based on patterns seen across municipal and industrial water systems, so you can see exactly which lever is worth pulling first at your own site.
What the Platform Actually Watches and Adjusts
An optimization platform is only as good as the decisions it can actually make on your behalf, and pumping is not a single decision, it is dozens of interlocking ones made every hour of every day. The capabilities below are the specific levers iFactory pulls automatically, each one scored and adjusted continuously rather than reviewed once a quarter during a maintenance meeting.
Find Out What Your Pump Station Is Actually Costing You
Bring twelve months of pump run-time, tank level, and electricity billing data to the call. We will show you where the recoverable energy is hiding at your specific site.
How AI Pump Scheduling Actually Runs, Hour by Hour
Most utilities assume "AI scheduling" means replacing the operator entirely, which is exactly why so many teams hesitate to adopt it. In practice, the platform runs as a continuous background process that recommends and, where authorized, automatically executes schedule adjustments, while every decision remains visible and reversible by the operations team on shift.
What This Has Delivered Across Real Pump Stations
Independent research and field deployments across water distribution networks, saltwater disposal operations, and industrial pump systems consistently point in the same direction: pumping is the most controllable major energy cost a water infrastructure operator has, and scheduling intelligence is what unlocks it. Reported reductions vary by station design and starting condition, but the pattern holds across very different systems and sizes.
Who Actually Owns This Once It's Running
One of the most common hesitations utilities raise before adopting an optimization platform is who ends up responsible when something goes wrong at three in the morning. The honest answer is that the operations team never stops owning the pump station, and the platform is built around that expectation rather than around replacing it. Every recommendation is visible in the same interface operators already use, every automated adjustment sits within limits the team configures up front, and manual override is always one click away. The platform's job is to remove the guesswork from thousands of small scheduling decisions a week, not to remove the operator from the loop. Over time, most teams find that the system earns enough trust to run more autonomously, but that trust is built gradually, station by station, rather than assumed on day one.
Savings Potential by Pump Station Type
Not every pump station has the same amount of recoverable energy sitting in it. A small booster station running one or two units behaves very differently from a large regional transmission station running six pumps against a variable tariff. The table below gives a realistic range by station type, based on the patterns most commonly seen once a site is actually instrumented and analyzed.
| Station Type | Typical Pump Count | Primary Waste Source | Recoverable Energy Range |
|---|---|---|---|
| Small Booster Station | 1-2 fixed-speed units | Off-curve operation, oversizing | 8-15% |
| Municipal Distribution Station | 3-4 mixed-speed units | Peak-tariff scheduling | 15-25% |
| Regional Transmission Station | 5+ parallel VFD units | Sequencing and pressure imbalance | 20-35% |
| Wastewater Lift Station | 2-3 duty-standby units | Cycling and undetected wear | 10-20% |
Curious what range your own station would fall into? Send our team a sample of your pump run-time and billing data and we will map it against these profiles for you.
What a First-Quarter Rollout Actually Looks Like
A pump optimization deployment does not need a full network overhaul before it starts paying for itself. The most successful rollouts start narrow, prove the model against real billing data, and expand once the numbers are visible to the whole team, not just the engineer who championed the project.
Why This Is Different From a One-Time Energy Audit
A traditional energy audit gives you a snapshot: an engineer walks the site, reviews a few months of billing data, and hands over a report with recommendations that were accurate the week they were written. The trouble is that a pump station is never static. Demand patterns shift with the seasons, tariffs change when a utility renegotiates its rate structure, and equipment efficiency drifts downward every month a bearing wears a little further. A report that was correct in March is often stale by August, and by the time the next audit is scheduled, the plant has already absorbed a year of avoidable spend based on assumptions that quietly stopped being true. AI-driven optimization replaces the one-time snapshot with a system that re-evaluates its own assumptions continuously, so the schedule your pumps are running today reflects this week's demand and this week's tariff, not last year's audit.
This distinction matters most during the events an audit can never anticipate: an unplanned dry spell that spikes demand, a sudden change in a utility's peak pricing window, or a pump that starts drawing more current than its nameplate rating because a bearing is failing. A static report has nothing to say about any of these situations because they had not happened yet when it was written. A continuously learning platform, by contrast, treats each of these as a new input, and adjusts the recommended schedule the same day the condition changes rather than waiting for the next scheduled review cycle. That responsiveness is where the majority of the compounding savings actually come from over a full year of operation, far more than the initial one-time gain most utilities expect when they first start the conversation.
Frequently Asked Questions
Get a Free Pump Energy Assessment for Your Station
Bring your run-time, tank level, and billing history to the call. We will show you exactly how much recoverable energy is sitting in your current pump schedule and what a first-quarter rollout would look like.