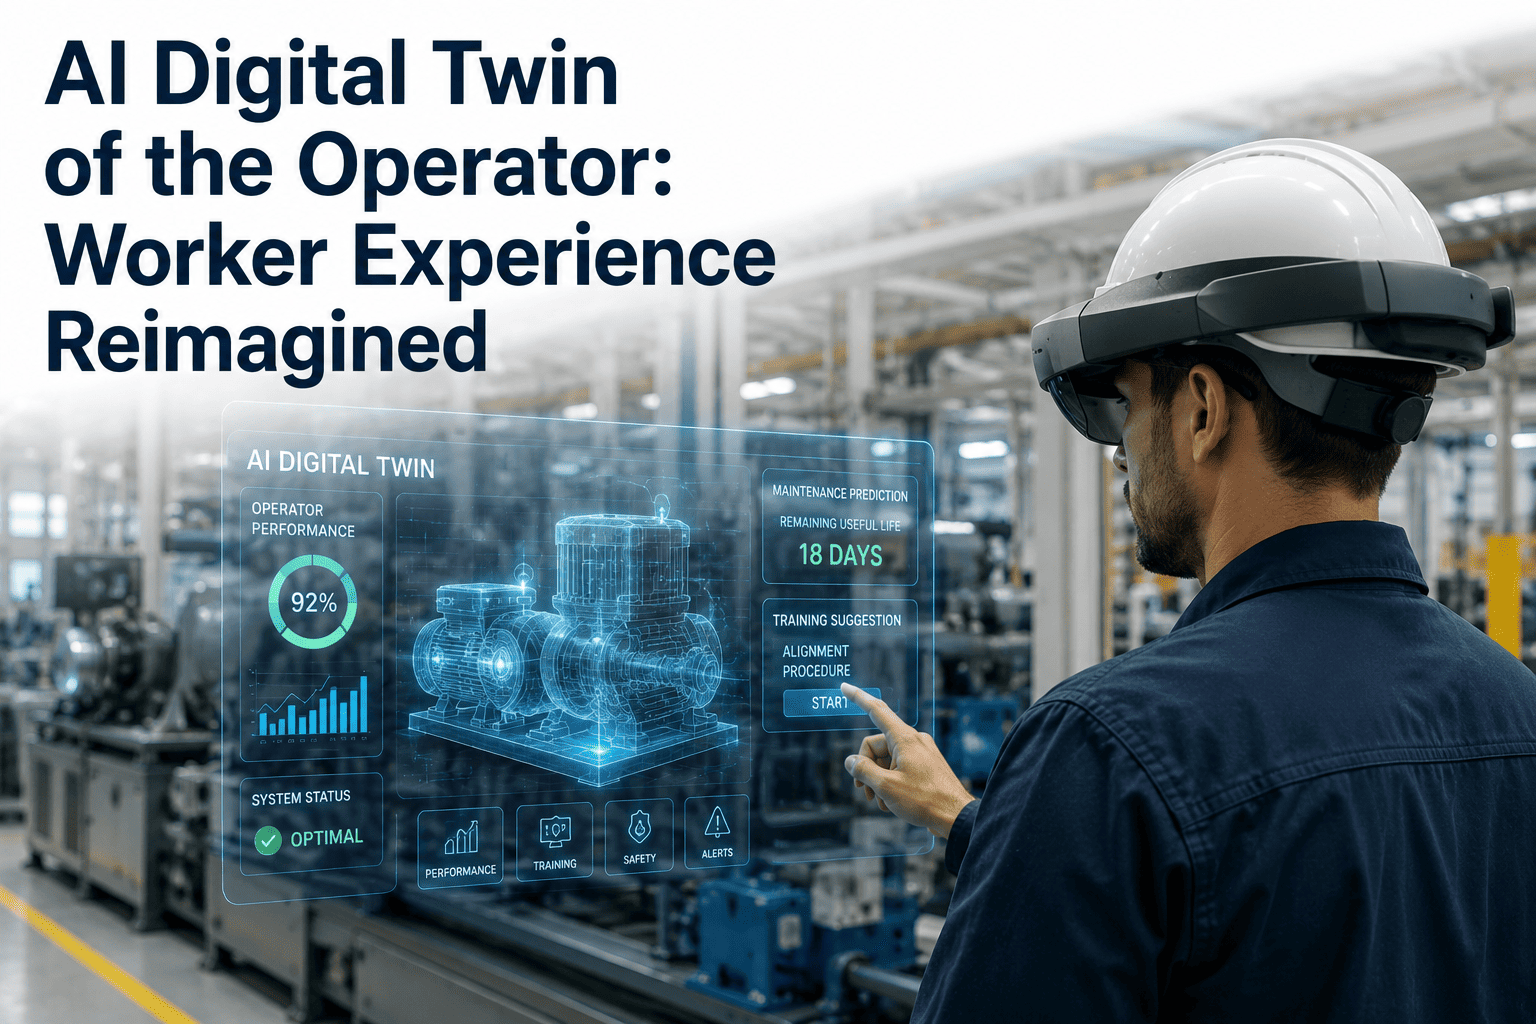
Walk through most plants and you will find a machine with more instrumentation than the person operating it. Vibration sensors, thermal cameras, and pressure gauges track every fluctuation in a press or a pump, yet the operator standing next to it is measured almost entirely by output volume and defect count. That asymmetry has a cost: plants that can predict a bearing failure three weeks out often cannot predict that their best operator on that line is three weeks from quitting. Closing that gap is what worker-experience AI is built for, and teams curious what it looks like in practice can Book a Demo to see it applied to a role like their own.
Instrument the Person, Not Just the Machine
iFactory captures operator effort, friction, and competence signals the same way plants already capture machine health, giving HR and operations a real signal for retention risk before an exit interview.
Why Plants Know More About Machines Than People
Predictive maintenance programs exist precisely because machine failure is expensive and mostly preventable if you catch the early signal. Operator turnover is arguably just as expensive, and just as preventable, yet almost no plant tracks the early signals of disengagement with anything close to the same rigor. Exit interviews happen after the decision is already made, engagement surveys arrive once or twice a year, and by the time either one produces a data point, the operator who mattered most has often already left.
The result is that operations leaders are frequently surprised by resignations that, in hindsight, had visible warning signs for weeks: declining cycle-time consistency, a rise in minor near-misses, more frequent short absences. None of those signals are secret, they simply are not being collected and connected anywhere.
Onboarding Friction
New operators show elevated cycle-time variance and more frequent stoppages, a normal but trackable learning curve.
Competence Building
Performance stabilizes and variance narrows as the operator internalizes the task, visible in the data well before it's visible to a supervisor.
Steady State or Drift
A stable, competent operator either holds steady performance or begins showing renewed variance, absence upticks, or engagement drift, both of which are trackable signals.
Building an Operator Digital Twin From Signals You Already Generate
A worker-experience AI model does not require new surveys or intrusive monitoring to get started. It draws from operational data most plants already collect for other purposes, connecting signals that normally live in separate systems into a single view of how an individual operator's experience is trending over time.
Performance Consistency
Cycle-time variance and quality metrics tracked per operator over time, separating genuine skill drift from normal day-to-day noise.
Attendance Patterns
Short-notice absences and shift-swap requests analyzed for trend changes rather than treated as isolated events.
Near-Miss and Safety Signals
A rising rate of minor safety events for an otherwise steady operator often precedes disengagement, not just fatigue.
Training and Cross-Skill Uptake
Willingness to take on new training or cross-training is a strong positive engagement signal; a sudden drop-off is worth noting.
How a Rollout Typically Progresses
Most HR and operations teams start with a single department or shift rather than the entire workforce, using that scope to validate that the signal patterns actually match what supervisors already sense anecdotally about their teams. That validation step matters because it builds trust in the data before it starts driving real conversations, and it gives HR a concrete before-and-after comparison to justify expanding scope.
Early weeks focus on connecting existing production and HR data sources and establishing a baseline for what normal variation looks like across different roles, since a meaningful signal only becomes visible once the model understands the normal range it's comparing against. From there, expansion to additional departments tends to move quickly, since the data integration work is largely reusable across the rest of the facility.
Select Pilot Group
Start with one department or shift to validate signal accuracy against what supervisors already observe.
Connect Data Sources
Integrate existing production and HR systems rather than standing up a separate parallel data set.
Establish Baselines
Give the model enough history to understand normal variation before flagging any meaningful drift.
Expand Coverage
Extend to additional departments once the pilot group confirms the signals are catching real, actionable patterns.
See Retention Risk Before It Shows Up in Turnover Numbers
A live walkthrough shows how operator signal tracking connects to your existing HRIS and production data without adding new survey burden.
What HR and Operations Do With an Engagement Signal
A flagged signal is a prompt for a conversation, not an automated intervention. The plants getting real value from this treat a drifting score as a cue for a supervisor check-in, a workload review, or a career-path conversation, delivered while there is still time to change the outcome rather than after a resignation letter is already on the desk.
The tone of that conversation matters as much as its timing. A supervisor opening with "I noticed your numbers have been off, what's going on" lands very differently than one opening with "how are you doing, is everything alright." The data exists to prompt the check-in, not to script it, and the most effective managers treat the signal as a private cue for genuine curiosity rather than something to reference directly with the operator.
| Signal Pattern | Likely Driver | Typical Response |
|---|---|---|
| Rising cycle-time variance | Fatigue, workload, or unresolved skill gap | Supervisor check-in, workload review |
| Increasing short absences | Burnout or personal strain | Direct conversation, schedule flexibility review |
| Declining training uptake | Disengagement or unclear growth path | Career-path conversation |
| Rising minor near-misses | Distraction or reduced focus | Wellbeing check, task rotation |
Why This Only Works as a Support Tool, Not a Scorecard
The fastest way to break trust in a worker-experience program is to let it become a covert performance-ranking tool. Operators who sense they are being scored for punitive purposes will disengage from the very behaviors the system is trying to protect. The programs that work are transparent about what is being tracked and why, and route findings toward support conversations and process fixes rather than disciplinary action, mirroring the same trust principle that applies to any workplace monitoring system.
HR Leadership
Gets an early, objective view of retention risk across the workforce instead of relying solely on annual survey snapshots.
Plant Operations
Sees which stations or shifts generate disproportionate strain, informing staffing and rotation decisions beyond individual cases.
Frontline Supervisors
Receives a prompt to check in with a specific operator, backed by data rather than relying purely on personal observation.
What Losing an Experienced Operator Actually Costs
Replacing an experienced operator is rarely just the cost of a job posting and a few weeks of recruiting. It includes the full onboarding ramp for a replacement, the productivity gap while that replacement climbs the same learning curve the departing operator once climbed, and the loss of institutional knowledge that a tenured operator carries about a specific line's quirks, workarounds, and failure modes that were never fully documented anywhere. None of that shows up neatly in a single line item, which is exactly why it tends to be underweighted in budget conversations until turnover is already high.
Early identification changes the math because it moves the intervention point earlier, when a supervisor conversation or a workload adjustment can still change the outcome, instead of after a two-weeks-notice email has already been sent. Even a modest reduction in preventable turnover among experienced operators tends to pay for a program like this many times over across a full year.
Recruiting and Onboarding
Every avoided departure skips an entire replacement hiring and training cycle for that role.
Institutional Knowledge
Tenured operators carry line-specific knowledge that rarely transfers cleanly through documentation alone.
Team Stability
Lower turnover on a crew reduces the ripple effect of constant onboarding on the operators who stay.
AI Digital Twin of the Operator — Common Questions
Does this require new surveys or wearables for operators?
No new hardware or survey burden is required to get started. The model draws from operational data most plants already collect, such as cycle-time records, attendance systems, and safety event logs, connecting it into a single trend view rather than asking operators to fill out anything new. Optional pulse surveys can be layered in later if a plant wants an additional qualitative signal.
Is this used to rank or discipline individual operators?
No, the intended use is early identification of support opportunities, not performance ranking or disciplinary evidence. Plants that use it for punitive purposes tend to see trust and data quality collapse quickly, which defeats the purpose of the program. It is designed and recommended to sit alongside HR and supervisor workflows as a support signal.
How does this connect to our existing HR systems?
The model integrates with standard HRIS and production data sources already in use at most plants, mapping operator identifiers across systems to build a single connected view without requiring a separate parallel database. Specific integration requirements for your existing systems can be reviewed with the iFactory Support team.
How accurate are the retention risk signals in practice?
The model surfaces correlated risk patterns rather than certainties, and it is deliberately framed as a prompt for a human conversation rather than a prediction to act on automatically. Its value comes from catching signals days or weeks earlier than they would otherwise surface, giving supervisors and HR more runway to intervene, not from claiming perfect foresight into any individual's decision.
How long before we see meaningful trend data after rollout?
Baseline patterns typically emerge within the first four to six weeks as the model establishes what normal variation looks like for each role and shift. Meaningful drift detection improves from there as more history accumulates. Teams wanting a clearer timeline for their specific workforce size can Book a Demo to walk through a rollout plan.
Give Your People the Same Visibility as Your Machines
See how operator signal tracking turns data you already have into earlier, more supportive conversations with your workforce.