CI Project Tracking & Benefits Realization Dashboard
By Johnson on August 13, 2026
Most continuous improvement programs don't fail at the workshop stage — they fail six months later, quietly, when nobody notices the changeover time has crept back up or the defect rate has drifted back toward baseline. The kaizen event gets closed out, the savings get reported once, and then the tracking stops entirely because nobody owns it past project sign-off. Without a system that keeps measuring after the ribbon-cutting, a plant can run dozens of improvement projects a year and still not be able to say, with a straight face, how much of that reported savings actually reached the P&L. This page walks through what a real CI tracking and benefits realization system looks like, and where you can see one running against your own project data.
Lean & Continuous Improvement
Track Every CI Project. Verify Every Dollar of Savings. Stop the Backslide.
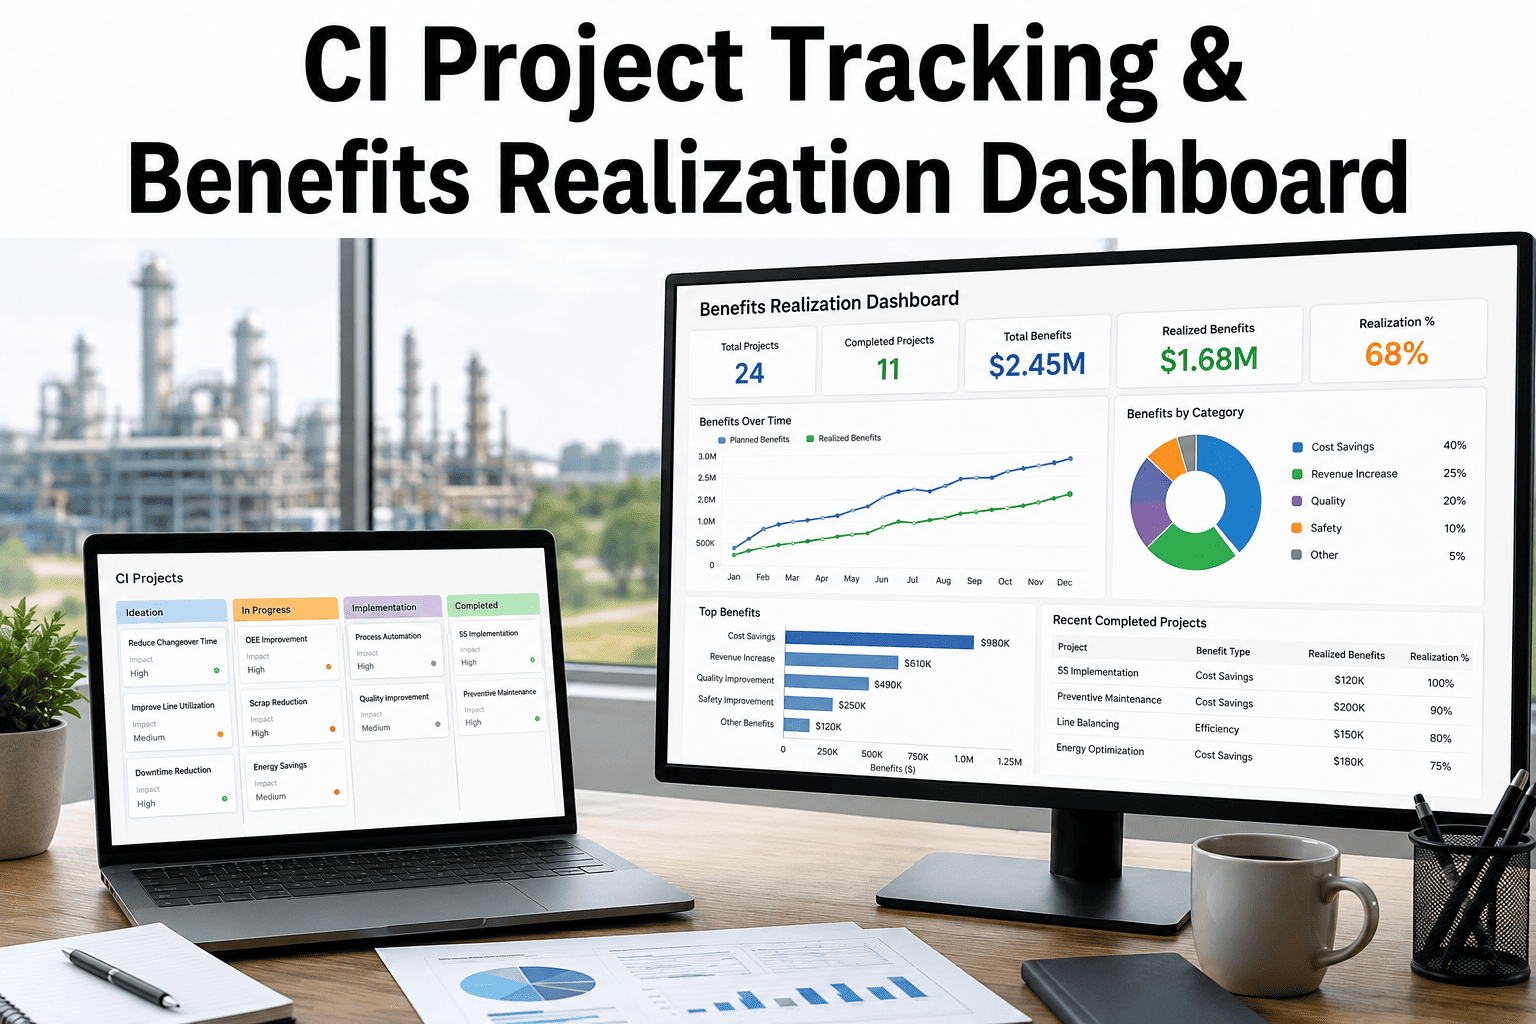
A live dashboard for your entire improvement portfolio — project status, projected versus verified savings, and automatic alerts when a metric drifts back toward its pre-project baseline.
Why "We Ran 40 Kaizen Events This Year" Doesn't Mean Much
Improvement activity and improvement results are not the same thing, and most CI programs measure the first while assuming it proves the second. A plant can run dozens of workshops, close them all with a completion certificate, and still have no reliable answer when a finance leader asks how much of the reported savings is actually sitting in this quarter's cost report. The disconnect happens because most CI tracking stops at project closure — the exact moment when sustaining the gain becomes harder than achieving it. Metrics quietly drift back toward baseline over the following months as the team that owned the change rotates onto new priorities, and by the time anyone checks, the gain has partially evaporated with no record of when it started slipping. A benefits realization system closes that gap by treating the project close-out as the midpoint of the tracking cycle, not the end of it.
Where Gains Disappear
Four Reasons Verified Savings Quietly Erode
No KPI Owner After Close-Out
Once a project is marked complete, the metric it improved often has nobody formally responsible for holding the line, so drift goes unnoticed until a much larger review catches it months later.
Control Plans That Exist on Paper Only
A documented control plan sitting in a shared folder does nothing if nobody checks adherence on the floor — the standard work quietly reverts the moment shift coverage changes.
Reported Savings Never Validated Against Actuals
Many programs report the projected savings from the project charter as the final result, without ever reconciling it against what actually moved in production or cost data.
Leadership Attention Moves to the Next Initiative
Once a project graduates from the active portfolio view, it stops getting reviewed in leadership meetings, and what isn't reviewed regularly tends not to stay owned.
The Difference Tracking Makes
Tracked CI Program vs Untracked CI Program
Dimension
Untracked / Spreadsheet-Based
Dashboard-Tracked with Live Data
Savings validation
Self-reported at project close, rarely reconciled
Continuously checked against live production and cost data
Post-close monitoring
None — project is considered finished
Automatic drift alerts against the pre-project baseline
Portfolio visibility
Scattered across spreadsheets by department or shift
Single live view of every active and completed project
Prioritization basis
Whoever advocates loudest in the meeting
Ranked by verified impact and effort-to-sustain
Leadership reporting
Manually compiled, often stale by the time it's presented
Real-time portfolio ROI available on demand
The Full Lifecycle
Five Phases a Benefits Realization System Actually Tracks
01
Baseline Capture
Before any change is made, the system logs the current-state metric — cycle time, scrap rate, changeover duration — directly from production data, not from an estimate written in a charter.
02
Active Project Tracking
While the project is running, status, owner, target metric, and projected savings sit in one portfolio view instead of a separate spreadsheet per department or shift.
03
Close-Out Validation
At completion, the dashboard compares the post-project metric against the baseline automatically, replacing self-reported savings with a number pulled straight from the data.
04
Sustainment Monitoring
For a defined period after close-out, typically three to twelve months, the metric keeps getting monitored against the baseline with alerts if it trends back toward pre-project levels.
05
Portfolio Rollup
Every project's verified savings rolls up into a single program-level ROI figure that leadership can trust, because each line item is backed by measured data, not a projection.
See the Gap in Your Own Numbers
Find Out How Much of Your Reported CI Savings Actually Held
iFactory connects your improvement project list to live production and cost data, so projected savings get checked against what actually happened — not what the charter predicted.
Typical reduction in operational costs within the first two years of a well-run Lean program
10-15%
Lower production costs reported by manufacturers running structured Kaizen event tracking
20-30%
Improvement in on-time delivery performance tied to sustained continuous improvement programs
70%
Average reduction in changeover time achieved through SMED projects that were tracked post-close
Applied Example
What Happens When a Program Adds Post-Close Tracking
A multi-site manufacturer had run a mature Kaizen program for years, closing roughly sixty improvement events annually across three plants. When a new operations director asked how much of the cumulative reported savings was still showing up in the cost reports, nobody could answer with confidence — the tracking stopped at project sign-off, and several metrics had quietly drifted back toward baseline without anyone noticing. After connecting the improvement portfolio to a live dashboard pulling directly from production and cost data, the team found that only a little over seventy percent of previously reported savings were still holding a year later. Rather than treating that as bad news, the plant used it to rebuild its sustainment process: every closed project now carries a defined monitoring window with an assigned metric owner, and drift alerts trigger a review before a gain fully erodes. Within two quarters, the sustainment rate on new projects climbed well above the historical baseline, and leadership finally had a portfolio ROI figure they were willing to defend in a budget meeting.
"
The kaizen event is the easy part. Anyone can get a metric to move for two weeks with a team fully focused on it. The hard part — the part almost nobody measures — is whether that metric is still holding a year later without the same amount of attention on it. If you're not tracking sustainment, you don't actually know if you improved anything.
Marcus Ondieki
Continuous Improvement Director · 18 years leading Lean and Six Sigma deployments across discrete manufacturing
Build the System
Four Steps to Set Up Real Benefits Realization Tracking
1
Standardize the Metric Before the Project Starts
Every project needs a clearly defined target metric pulled from the same data source that will validate it later, so there's no ambiguity about what "success" means at close-out.
2
Assign a Sustainment Owner, Not Just a Project Owner
The person who ran the workshop is often not the right person to own the metric long-term — assign a shift or area owner whose job includes holding the gain after the project team disbands.
3
Set a Defined Monitoring Window
Decide upfront how long a metric gets watched after close-out — three months for a quick changeover fix, twelve months for a larger process redesign — so tracking doesn't quietly stop by default.
4
Roll Every Project Into One Portfolio View
Consolidate active and closed projects into a single dashboard so leadership sees program-level ROI at a glance instead of chasing down status from six different spreadsheets.
CI Tracking Questions
Frequently Asked
What is benefits realization in a continuous improvement program?
Benefits realization is the structured process of validating, tracking, and sustaining the measurable improvements a project delivers, rather than simply reporting the projected savings written into the original project charter. It extends the tracking window well past project close-out, since most gains that are lost slip away gradually over the following months rather than disappearing all at once. Book a demo to see how live tracking closes that gap.
Why do continuous improvement gains fade after a project closes?
Gains typically erode because nobody is formally assigned to own the metric once the project team disbands, control plans exist only on paper instead of being checked on the floor, and leadership attention naturally shifts to the next initiative. Without a defined sustainment window and an assigned owner, standard work quietly reverts as shift coverage and priorities change. Talk to support about setting up sustainment tracking for your program.
How do I know if my reported CI savings are actually real?
The only reliable way is to reconcile the reported figure against live production or cost data rather than accepting the number written in the project close-out report. A dashboard that pulls directly from your existing production data can automatically compare post-project performance against the pre-project baseline, which is a far more defensible number in a budget conversation than a self-reported estimate. Book a call to validate your current portfolio.
What metrics should a CI tracking dashboard include?
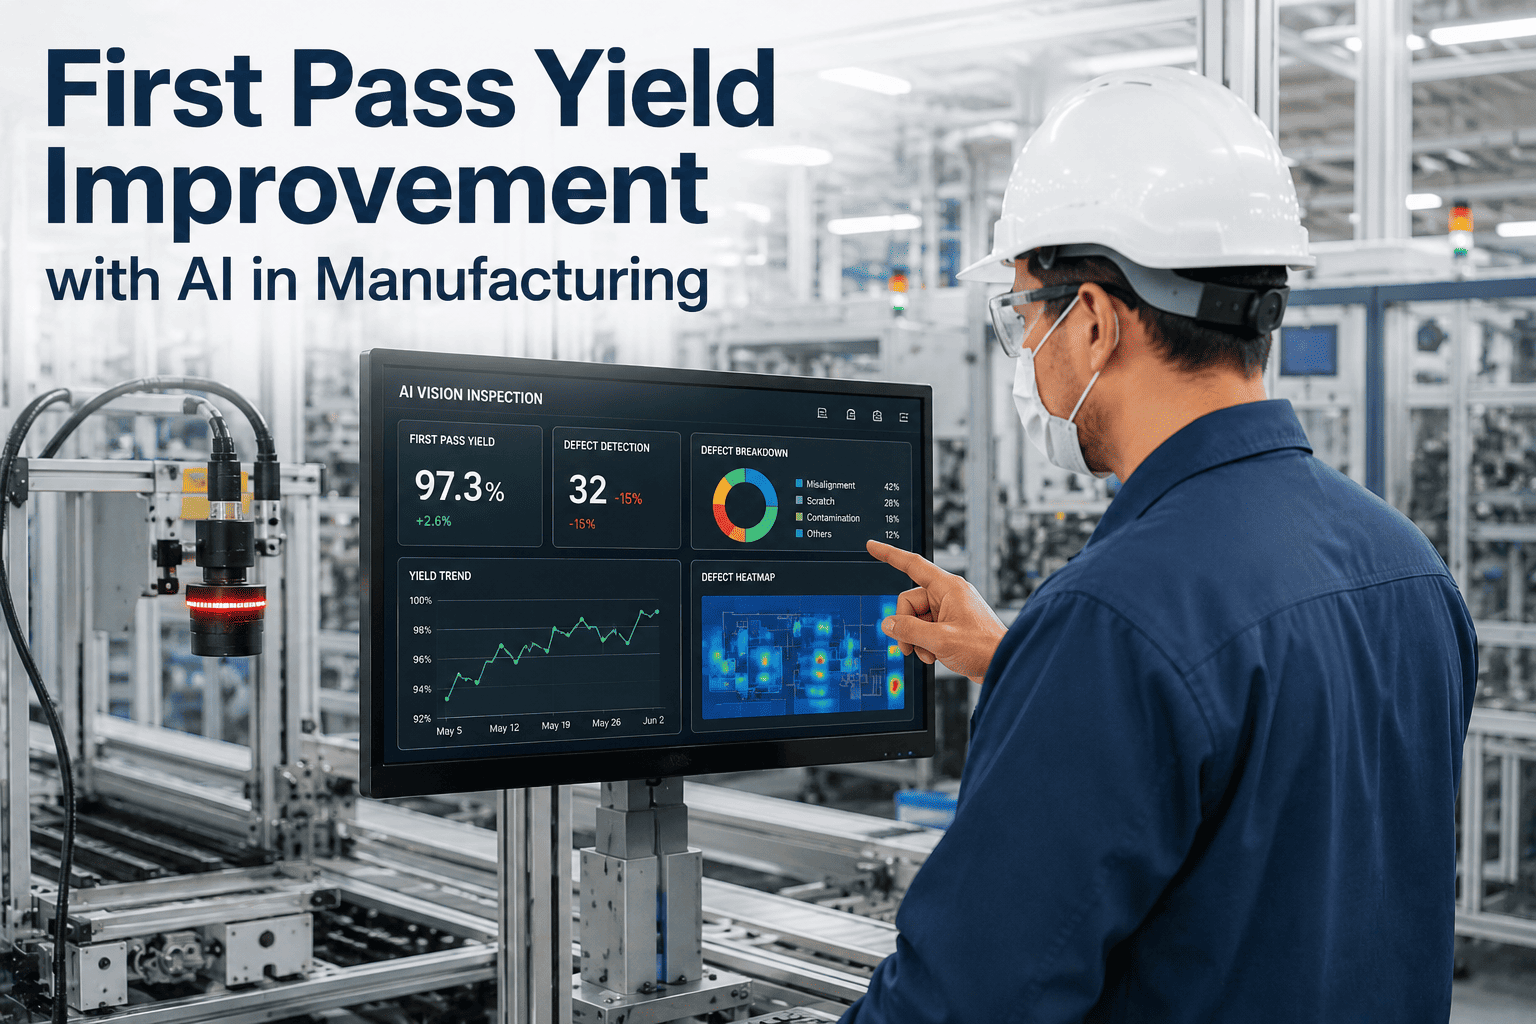
Most manufacturing CI programs track OEE, throughput, unplanned downtime, changeover duration, first pass yield, scrap and rework rates, and on-time delivery, though the right set depends on which process each project actually targeted. The dashboard should tie each active or closed project to the specific metric it's meant to move, not a generic plant-wide scorecard. Contact our team to map the right metrics to your project types.
How long should a project be monitored after it closes?
Monitoring windows should scale with the size of the change — a quick changeover fix might only need three months of post-close tracking, while a larger process redesign or layout change often needs six to twelve months before the gain can be considered stable. Shorter windows on bigger changes are one of the most common reasons sustainment tracking misses a slow drift back to baseline. Book a scoping session to set the right window for your project mix.
Know What Your CI Program Actually Delivered
Track the Full Lifecycle, From Baseline to Verified, Sustained Savings
iFactory connects your improvement project portfolio to live production data, so every project gets validated at close-out and monitored afterward — giving you a program ROI figure leadership can actually trust.