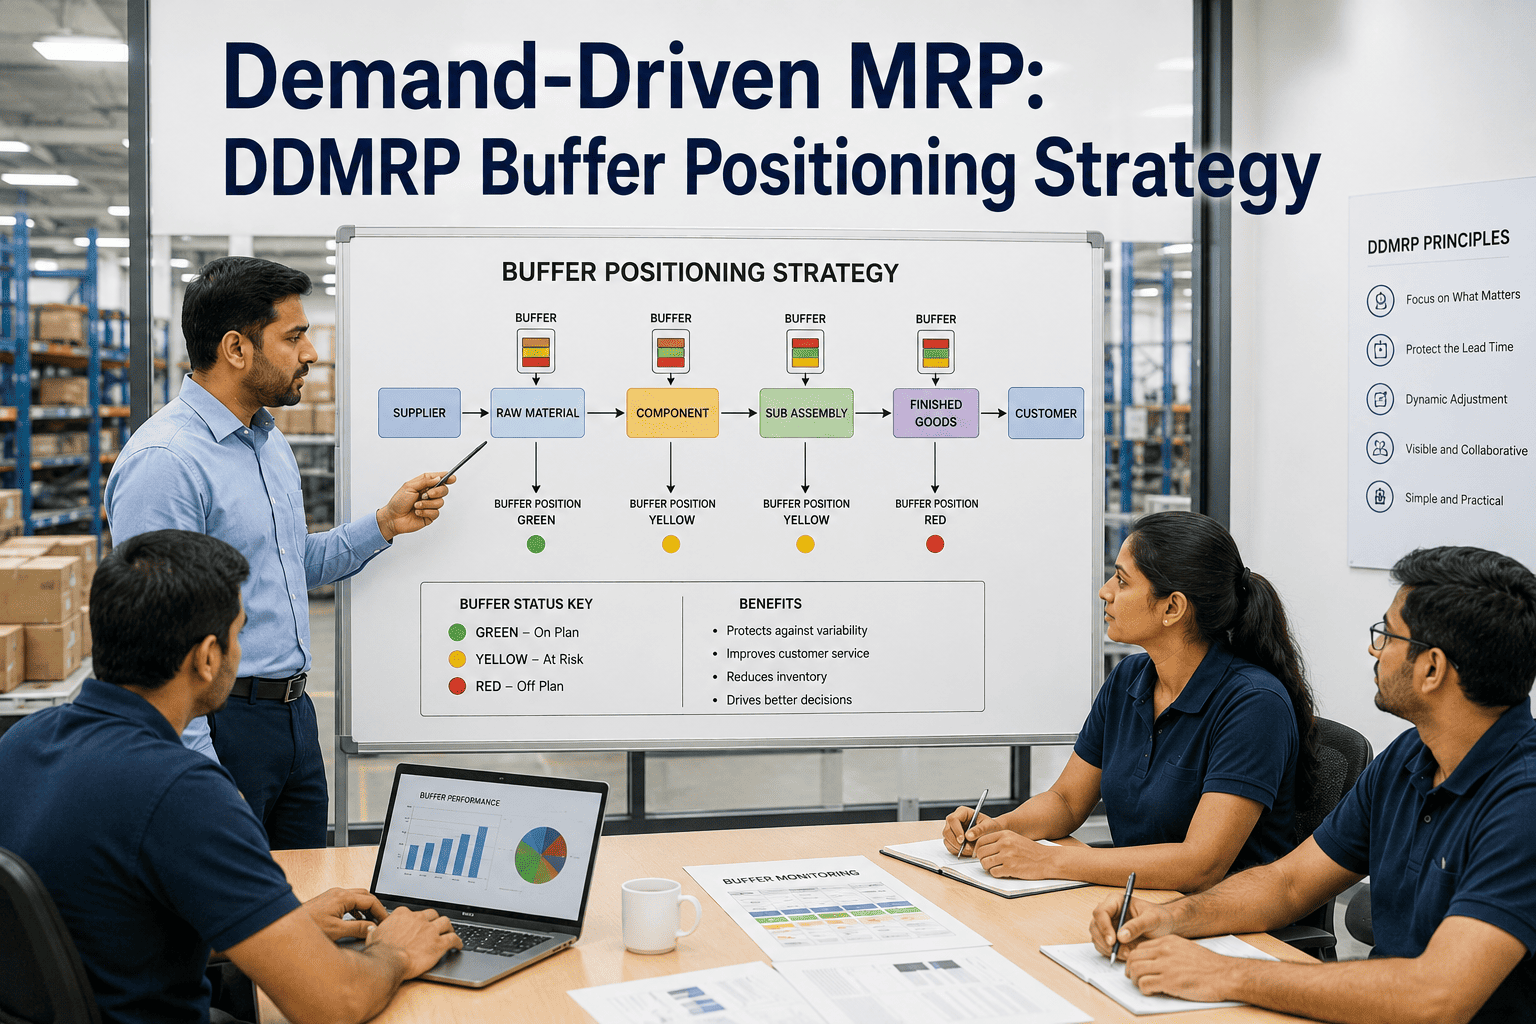
A planner staring at an MRP nervous breakdown knows the feeling well: one late shipment ripples through a multi-level bill of materials, the forecast gets revised, and suddenly hundreds of purchase orders need re-expediting even though actual customer demand barely moved. Traditional MRP was built for a slower, more predictable world, and it struggles badly once lead times stretch and demand starts swinging week to week. Demand-Driven MRP was developed to fix exactly this problem, replacing forecast-driven push planning with strategically placed buffers that absorb variability before it can spread. Manufacturers running DDMRP are pulling material based on what is actually being consumed rather than what a forecast predicted six weeks ago, and the shift starts by booking a DDMRP readiness session with iFactory's planning team.
Find Your Decoupling Points Before You Build the Buffers
iFactory's planning team can walk your bill of materials with you and flag where strategic buffers will actually change flow, not just add stock.
Why Conventional MRP Keeps Breaking in Volatile Demand
Classic MRP assumes a stable world: a forecast that holds steady, lead times that don't shift, and a bill of materials that can be exploded level by level without anything going sideways in between. Real manufacturing rarely cooperates. A single supplier delay at a lower BOM level cascades upward, triggering plan nervousness across every dependent item, and planners end up spending their day chasing expedites instead of managing exceptions that actually matter. DDMRP was built specifically to interrupt that cascade.
The method emerged from a straightforward observation: the more variable and interconnected a supply chain becomes, the worse a fully synchronized, forecast-driven plan performs. Instead of trying to predict every disruption in advance, DDMRP accepts that variability is a permanent feature of modern manufacturing and designs the plan around absorbing it at specific, deliberately chosen points. That reframing is what separates DDMRP from simply adding more safety stock everywhere, since a blanket buffer strategy still leaves critical items underprotected while tying up capital in items that never needed the cushion in the first place.
Plan Nervousness
A small forecast revision or a single late receipt re-triggers the entire multi-level plan, generating a wave of new exceptions that were never real problems in the first place.
The Bullwhip Effect
Small shifts in actual demand get amplified as they travel back through each tier of the supply chain, leaving upstream suppliers overbuilding or underbuilding relative to real consumption.
Uniform Safety Stock
Traditional planning tends to apply the same safety stock logic everywhere, which means critical items are underprotected while low-risk items sit overstocked on the shelf.
Expedite-Driven Planning
Planners spend most of their day firefighting urgent shortages instead of managing the handful of exceptions that genuinely threaten the flow of production.
The Five Components That Make DDMRP Work
DDMRP is not a single trick or a software feature; it is a structured method built around five linked components. Each one feeds the next, forming a loop that continuously adjusts as real demand and supply conditions change on the floor.
This is also where DDMRP differs most sharply from a typical "add safety stock and hope" approach. Each of the five components has a specific, repeatable input and output, which means the method can be audited, taught, and improved over time rather than relying on one planner's intuition. A team that has never run DDMRP before can typically get through the first two components, positioning and sizing, within a few weeks for a pilot scope, then spend the following quarter tuning the dynamic adjustment rules as real consumption data accumulates.
Strategic Inventory Positioning
Decide which items in the bill of materials become decoupling points, based on lead time, variability, and how critical the item is to protecting flow.
Buffer Profiles and Levels
Size each buffer using red, yellow, and green zones calibrated to lead time category, variability, and the item's order cycle.
Dynamic Adjustments
Buffer levels flex automatically for seasonality, promotions, planned events, or shifts in supplier lead time, instead of staying fixed until someone remembers to update them.
Demand-Driven Planning
Supply orders are generated from actual on-hand stock, open supply, and qualified demand, not from exploding a static forecast down through every BOM level.
Visible and Collaborative Execution
Planners work from a color-coded priority view instead of a flat expedite list, focusing attention on the buffers actually at risk of breaching.
Where a Decoupling Point Actually Belongs
Placing buffers everywhere defeats the purpose of DDMRP just as badly as placing none at all. The method uses a defined set of criteria to decide which items in a bill of materials deserve a strategic buffer and which should simply flow through the plan without one.
Getting this selection right takes an honest look at the bill of materials rather than a blanket policy applied to every item. A component that looks unremarkable on paper can still be the right decoupling point if it feeds three different finished goods, while an expensive, high-visibility part might not need a buffer at all if its lead time is short and stable. This is precisely the kind of judgment call that benefits from analyzing actual historical consumption and lead time data rather than relying on a planner's memory of which items caused problems last quarter.
Items with long or unpredictable lead times are strong candidates, since a buffer here compresses the customer-facing lead time downstream.
Components exposed to high demand or supply variability need protection so that swings don't propagate into every item built from them.
Parts feeding a bottleneck operation are prioritized, since a shortage here stalls the entire constraint rather than a single line item.
If a customer won't wait for the full cumulative lead time of an item, a decoupling point closer to the finished good becomes necessary.
Items used across multiple finished goods make efficient decoupling points, since one buffer protects flow for every downstream product that consumes it.
Where holding inventory is cheaper than holding excess capacity, a buffer becomes the more economical way to absorb variability.
How Buffer Zones Turn a Number Into a Priority
Every DDMRP buffer is split into three zones that turn a raw stock number into an instant priority signal for the planner. Instead of scanning a spreadsheet for anything below reorder point, the color zone tells a planner at a glance whether an item is healthy, approaching risk, or already urgent.
Green Zone
The top portion of the buffer, sized around order frequency. Stock here signals a healthy position with no replenishment action needed yet.
Yellow Zone
The middle band, sized to cover average demand across the item's lead time. Consumption here is where a replenishment order gets triggered.
Red Zone
The safety layer sized to the item's variability. Stock dropping into this zone flags genuine urgency and pulls planner attention immediately.
Push-Based MRP vs a Demand-Driven Platform
The difference between forecast-push planning and demand-driven planning shows up most clearly in how each system responds when reality diverges from the plan. Here is the comparison across the dimensions planners care about most.
Swipe left to see the full comparison
What the iFactory DDMRP Platform Actually Does
Running DDMRP by hand on a spreadsheet works for a pilot with a handful of items. Scaling it across a full bill of materials needs a system that can calculate, monitor, and adjust buffers continuously. This is what iFactory's platform handles underneath the plan.
Decoupling Point Recommendation
Lead time, variability, and BOM position data are analyzed to recommend which items are strong candidates for a strategic buffer.
Automated Buffer Sizing
Red, yellow, and green zone sizes are calculated per item from lead time category, order cycle, and demand variability, not a flat percentage.
Dynamic Buffer Adjustment Engine
Buffers flex automatically for known future events, seasonality trends, and supplier lead time changes, without a manual recalculation cycle.
Net Flow Position Monitoring
On-hand stock, open supply, and qualified demand are combined continuously to generate accurate net flow positions for every buffered item.
Color-Coded Execution Dashboard
Planners see a prioritized, exception-driven view of which buffers are healthy, at risk, or urgent, replacing a flat spreadsheet expedite list.
Performance and Alert Tracking
Buffer breach frequency, service level, and inventory investment are tracked over time, flagging when a buffer profile needs to be revisited.
From the Bill of Materials to the Planner's Screen
DDMRP only works if the buffer logic is connected to the same systems already running production. iFactory's platform sits between your ERP's BOM and routing data and the daily execution view your planners actually work from.
BOM and Lead Time Data
Bill of materials structure, routing data, and supplier lead times feed the decoupling point analysis directly from your existing ERP.
Zone Sizing and Adjustment Engine
Buffer profiles, zone sizes, and dynamic adjustment rules run continuously against real consumption and open supply at each decoupling point.
Planner Priority Dashboard
Net flow positions roll up into a color-coded planner view, ready to guide daily replenishment decisions. Talk to a specialist about your current planning setup before scoping a rollout.
What Changes Once Buffers Replace Forecast-Push Planning
Manufacturers that move from a fully forecast-driven MRP to a DDMRP model consistently see the same shift across a handful of planning metrics. Here is the typical before-and-after on a mid-complexity bill of materials.
Perspective From the Field
Before DDMRP, every planning meeting started with someone asking why the entire schedule had shifted overnight because one supplier was three days late on a low-value bracket. Once we placed decoupling points at the right levels of the bill of materials, that same late delivery just gets absorbed by the buffer instead of rippling through forty downstream work orders. Our planners finally spend their day on the handful of buffers that are actually turning red, not chasing a list that changes every time someone touches the forecast.
— Daniel Osei, Materials Planning Manager, industrial equipment manufacturer
linked components that make up a complete DDMRP planning and execution cycle
red, yellow, and green bands that turn a stock number into an instant priority signal
typical cadence for dynamic buffer adjustment once a program is fully running
Frequently Asked Questions
Is DDMRP just a new name for MRP with safety stock?
No, the underlying logic is fundamentally different. Traditional MRP pushes material based on a forecast exploded through every level of the bill of materials, recalculating the entire plan whenever something changes upstream. DDMRP instead positions a smaller number of strategic buffers at decoupling points and pulls material based on actual consumption, open supply, and qualified demand at those points. Safety stock in traditional MRP tends to be applied broadly and rarely revisited, while DDMRP buffers are sized per item and adjusted dynamically as lead time and variability change. The result is a system that absorbs disruption locally instead of letting it cascade. Book a call to see how this plays out on your own bill of materials.
How do we decide which items become decoupling points?
DDMRP uses a defined set of criteria rather than gut feel: lead time length and variability, exposure to demand or supply variability, whether the item feeds a critical or bottleneck operation, customer tolerance time, whether the component is shared across multiple finished goods, and whether holding stock is more economical than holding excess capacity. Items that score high on several of these criteria are strong candidates for a strategic buffer, while low-risk, stable items typically flow through the plan without one. Getting this selection right is what separates a program that meaningfully compresses lead time from one that just adds inventory in the wrong places.
What do the red, yellow, and green buffer zones actually mean?
Each buffer is split into three stacked zones sized from lead time, order cycle, and variability data specific to that item. The green zone at the top reflects a healthy position tied to order frequency, with no action needed. The yellow zone covers the average demand expected across the item's lead time, and stock dropping into this band is what triggers a replenishment order. The red zone is the safety layer sized to the item's variability, and stock reaching this level signals genuine urgency that deserves planner attention right away. Together, the three zones turn a raw inventory number into an instant, visual priority signal.
Can DDMRP run alongside our existing ERP's MRP module?
Yes, most manufacturers run DDMRP for the items that qualify as decoupling points while leaving low-risk, stable items on standard MRP logic within the same ERP. The bill of materials structure, routing data, and lead times that already exist in your ERP feed the decoupling point analysis directly, so a rollout typically layers buffer logic on top of your current system rather than replacing it outright. Talk to a specialist about how DDMRP would integrate with your specific ERP and master planning setup.
How long does a DDMRP pilot typically take to show results?
A focused pilot on one product family or a limited set of decoupling points usually moves from initial buffer positioning to a live execution dashboard within a matter of weeks, since most of the setup work is analyzing existing lead time and variability data rather than building new infrastructure. Early results, such as fewer plan re-explosions and a smaller expedite list, are often visible within the first few planning cycles, while inventory and service level improvements typically become clear over a full quarter of running buffers. The exact pace depends on data quality and how many items are in scope. Book a scoping call to get a timeline specific to your bill of materials.
Stop Letting One Late Receipt Rewrite Your Entire Plan
Book a 30-minute scoping call and iFactory will walk your bill of materials to identify strategic decoupling points and build a DDMRP rollout plan for your planning team.