Every point your OEE score loses from a perfect 100% falls into one of exactly six categories, first defined decades ago and still the most reliable diagnostic tool a continuous improvement team has. The problem is that most plants can only name one or two of them by instinct — usually breakdowns and defects — while the other four quietly erode capacity in the background because nobody is measuring them precisely enough to see. Availability losses stop the line outright, performance losses slow it down without anyone noticing, and quality losses turn good material into scrap after all that time and energy is already spent. AI-driven monitoring gives each of the six a distinct, measurable signature instead of a vague shrug at the end of the month, and book a demo to see which of the six is costing your plant the most right now.
Continuous Improvement · Loss Elimination
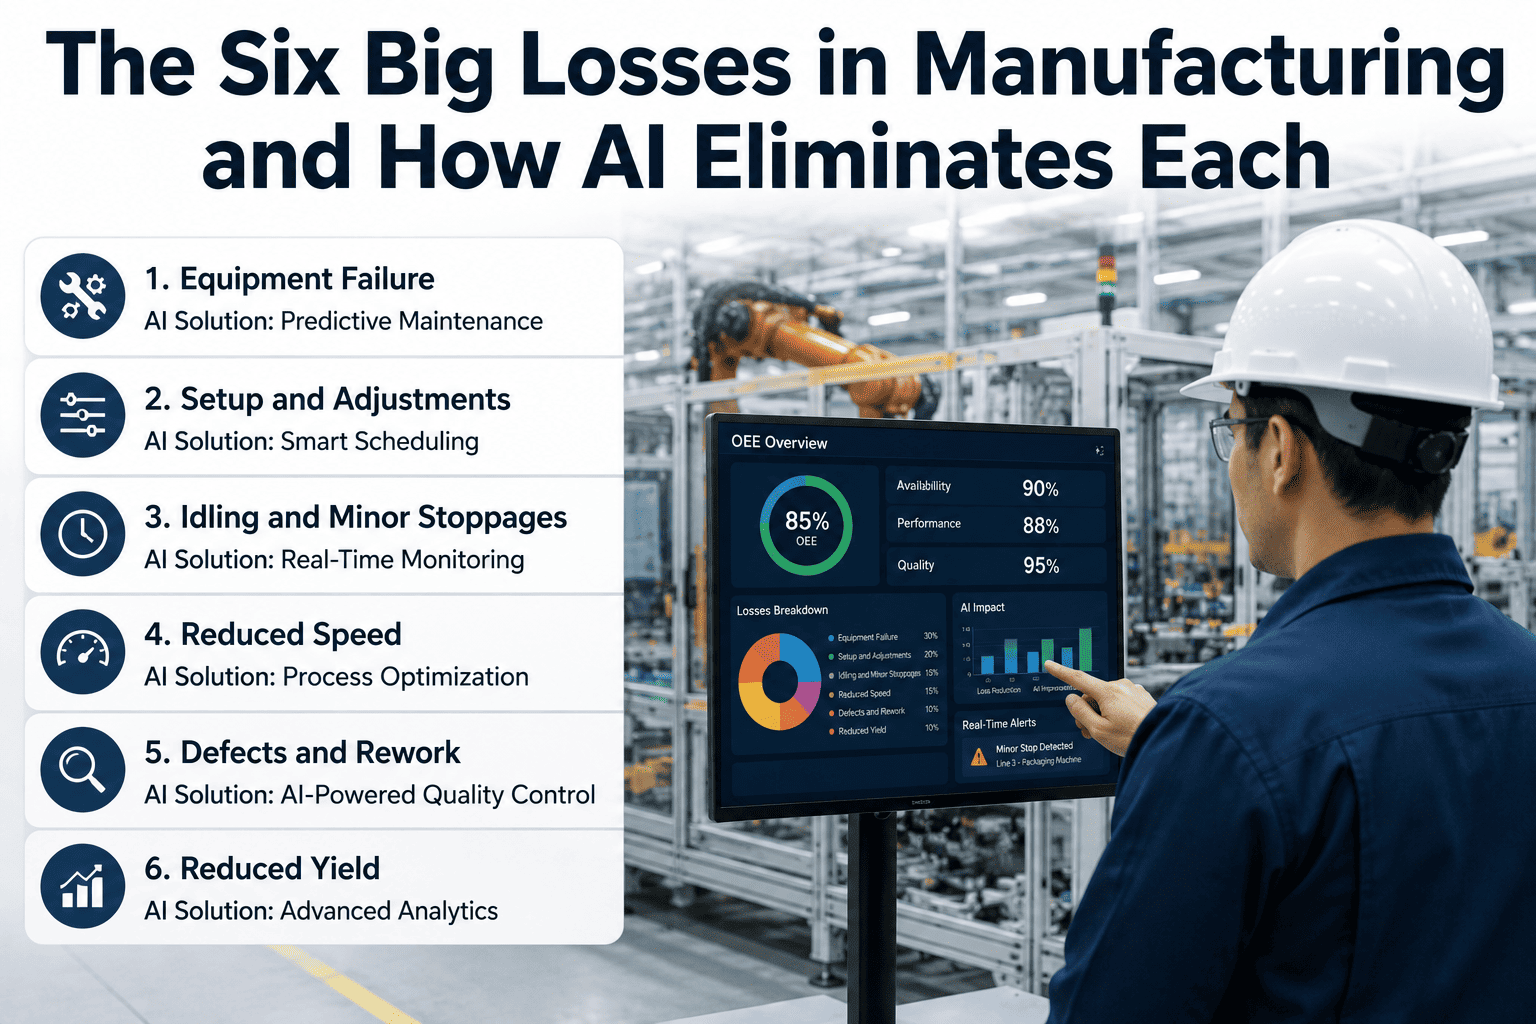
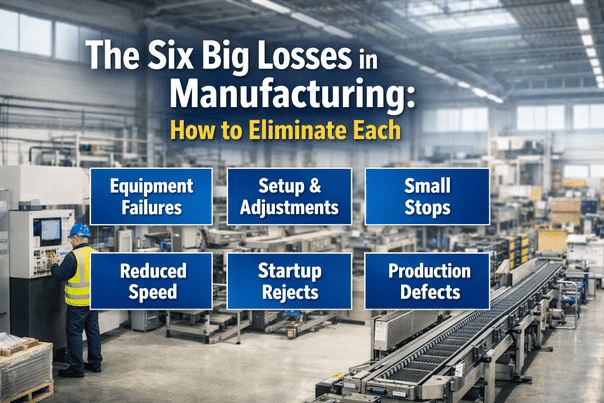
The Six Big Losses in Manufacturing and How AI Eliminates Each
Breakdowns, setups, minor stops, speed loss, startup defects, and process defects — the complete map of where OEE points actually go, and how each one gets closed.
6
Loss categories that account for nearly all OEE erosion
3
OEE factors each loss category ultimately damages
30-45%
Of rated capacity typically hidden inside these six losses
How the Six Losses Map to Your OEE Score
Each of the six losses damages exactly one of the three factors that multiply together to produce your final OEE number. Knowing which factor is bleeding tells you which two losses to investigate first.
Availability
Breakdown Loss
Setup & Adjustment Loss
Performance
Minor Stop Loss
Reduced Speed Loss
Quality
Startup Defect Loss
Process Defect Loss
Loss 1 & 2: The Losses That Stop the Line
Breakdown Loss
Availability
The Problem
Unplanned mechanical or electrical failure halts production entirely, often with no warning and no clear pattern from the maintenance log alone.
How AI Eliminates It
Condition-based sensors track vibration, temperature, and current draw continuously, flagging degradation patterns days or weeks before failure so maintenance becomes scheduled instead of emergency.
Setup & Adjustment Loss
Availability
The Problem
Time spent switching tooling, recipes, or product configurations between runs, frequently stretched by inconsistent operator technique.
How AI Eliminates It
Computer vision and timestamped step tracking identify which internal setup tasks could be done externally, guiding SMED-style changeover reduction with data instead of guesswork.
Loss 3 & 4: The Losses That Slow It Down
Minor Stop Loss
Performance
The Problem
Short jams and pauses under five minutes happen dozens of times a shift and are almost never captured on a manual log, yet they can drag performance down by ten points or more.
How AI Eliminates It
Continuous cycle-level monitoring catches every stop automatically and clusters them by cause, revealing patterns like a misaligned guide that a human would never connect across forty separate incidents.
Reduced Speed Loss
Performance
The Problem
Equipment running below its rated cycle time due to wear, cautious operator settings, or upstream material inconsistency.
How AI Eliminates It
Real-time cycle time tracking compares actual speed against rated speed continuously, isolating exactly when and why a line quietly settles into a slower rhythm.
Loss 5 & 6: The Losses That Waste What Already Ran
Startup Defect Loss
Quality
The Problem
Scrap produced while a line warms up or restabilizes after a stop, changeover, or shift start — often treated as an unavoidable cost of doing business.
How AI Eliminates It
Predictive stabilization models learn the optimal ramp-up curve for each product and guide operators through it, shrinking the warm-up window where defects concentrate.
Process Defect Loss
Quality
The Problem
Units rejected or reworked during otherwise normal, steady-state running because a process variable drifted outside spec.
How AI Eliminates It
Statistical process control combined with machine vision catches drift the moment it starts, alerting operators before a run of good parts turns into a run of scrap.
You can't eliminate a loss you can't measure. Most improvement programs stall because they attack the two losses everyone already knows about and leave the other four invisible.
Expert Insight
In almost every plant I've walked, the improvement team can tell you their breakdown history down to the hour, and they have absolutely no idea how many minor stops happened last Tuesday. That asymmetry is the whole story of why OEE programs plateau. Breakdowns are dramatic and get written down. Minor stops and speed loss are quiet, distributed across hundreds of small events, and invisible to anyone without continuous machine-level data. The plants that break through sixty percent OEE are almost always the ones that started measuring the losses nobody was arguing about, simply because nobody could see them yet.
Priya Sundaram — Continuous Improvement Consultant, Certified TPM Practitioner, 20+ years across automotive and CPG manufacturing
Typical Loss Distribution Before and After AI Monitoring
| Loss Category |
Typical Share of Total Loss |
Visible on Manual Logs |
Visible with AI Monitoring |
| Breakdown Loss |
High |
Yes, usually well tracked |
Yes, plus early failure prediction |
| Setup & Adjustment Loss |
Moderate |
Partially, often underestimated |
Yes, broken into internal vs external tasks |
| Minor Stop Loss |
Very High |
Rarely, under five minutes goes unlogged |
Yes, captured automatically at the cycle level |
| Reduced Speed Loss |
High |
Rarely, assumed constant across a shift |
Yes, tracked continuously against rated speed |
| Startup Defect Loss |
Moderate |
Partially, often bundled into general scrap |
Yes, isolated to the specific ramp-up window |
| Process Defect Loss |
Moderate |
Partially, caught after the fact by inspection |
Yes, flagged the moment a variable drifts |
Frequently Asked Questions
Which of the six losses should we tackle first?
Start with whichever factor — availability, performance, or quality — is dragging your overall OEE down the most, which requires accurate measurement to identify honestly. In practice, minor stops and speed loss are the most commonly underestimated because manual tracking simply cannot see them, so they're often the biggest hidden opportunity.
Book a demo to get a loss breakdown specific to your lines.
Do all six losses apply equally to every type of manufacturing?
The six categories apply universally, but their relative size varies by process. High-mix, low-volume operations tend to carry more setup and adjustment loss as a structural feature of the business, while high-volume continuous lines tend to see minor stops and speed loss dominate. Context matters more than the raw percentage.
Contact support to discuss which losses are most relevant to your process type.
Why don't manual logs capture minor stops and speed loss accurately?
Manual tracking depends on someone noticing and writing down an event, and a thirty-second jam or a slight cycle time drift rarely meets the bar for a written note during a busy shift. Automated monitoring captures every cycle at the machine level continuously, which is why plants routinely find their real OEE is eight to fifteen points lower than their spreadsheet once accurate data comes online.
Book a demo to see the gap on your own equipment.
How does AI actually distinguish between the six loss types automatically?
Each loss category has a distinct signature in machine data — a breakdown looks like a hard stop with a fault code, a minor stop looks like a short pause with no fault, reduced speed looks like a sustained cycle time gap, and quality losses show up as reject signals tied to specific process windows. Classifying events this way is exactly the kind of pattern recognition machine learning handles well.
Contact support for a technical walkthrough of the classification approach.
Can this integrate with an existing TPM or lean program?
Yes. AI-based loss classification is designed to strengthen an existing TPM or lean program rather than replace it, giving improvement teams accurate, cycle-level data to feed into the same root cause analysis and kaizen processes already in place. Most plants find their existing improvement methodology works better once the underlying loss data is finally trustworthy.
Book a demo to see how it layers onto your current program.
Find the Losses Your Logbook Never Caught
All six loss categories, classified automatically and ranked by impact — so your improvement program targets the right one first.