Most plants can tell you exactly how much steel, resin, or packaging they bought last quarter, but almost none can tell you where all of it actually went once it left the receiving dock. Scrap gets baled without being weighed, off-spec product gets landfilled instead of reworked, and cardboard, pallets, and mixed plastics pile up in a corner because nobody owns the waste stream the way someone owns the production line. That blind spot is now a financial and regulatory problem, not just an environmental one, as landfill tipping fees climb and extended producer responsibility laws spread across more states. iFactory's AI-powered waste and circularity platform turns every bin, baler, and disposal invoice into tracked data, and you can book a demo to see your own waste streams mapped in real time.
You Are Paying to Buy Materials, Paying to Dispose of Them, and Paying the Tipping Fee In Between
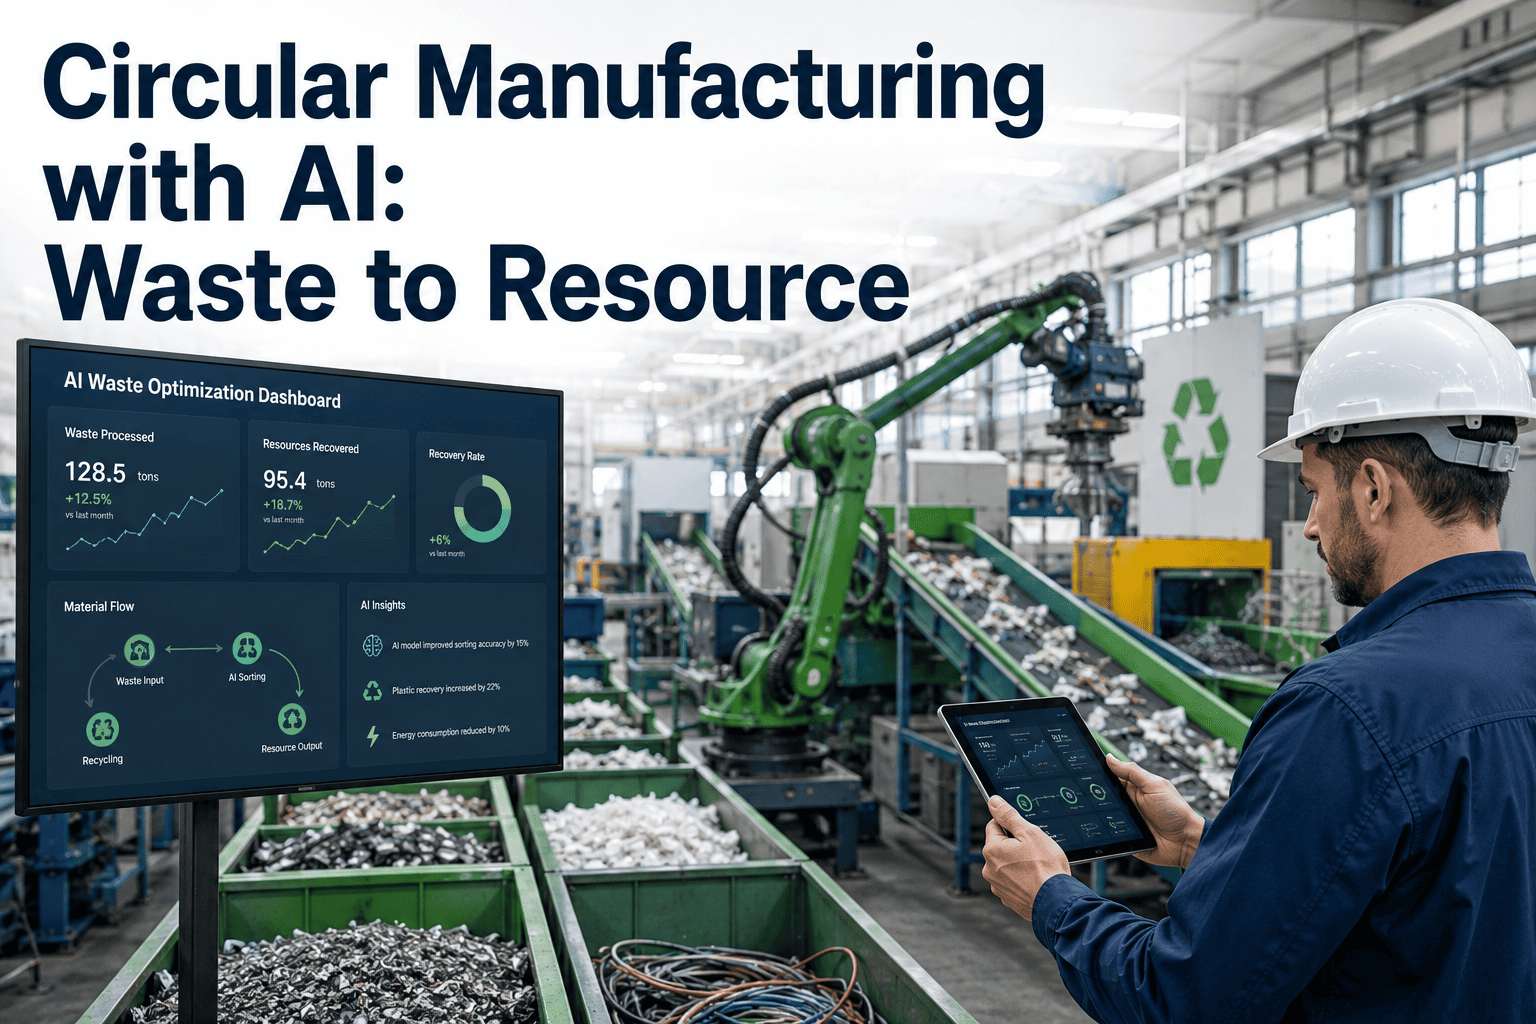
iFactory's AI platform maps every waste stream on your floor, tells you exactly which materials are recoverable versus truly landfill-bound, and converts that gap into a ranked, dollar-quantified diversion plan for your team.
Waste Is a Triple Cost, and Most Plants Only Track One of the Three
Every unit of manufacturing waste carries three separate costs stacked on top of each other: the original purchase price of the material, the labor and energy spent turning it into scrap instead of product, and the disposal fee paid to haul it away. Most cost accounting systems only capture the third one, which means the true cost of waste is routinely understated by a wide margin, sometimes by a factor of five or more once material and labor are added back in. The figures below reflect benchmarks gathered across discrete and process manufacturing facilities currently working to formalize waste reduction and circularity programs, and they are a useful starting point for any plant trying to size its own opportunity before committing to a full audit.
Five Places Waste Accumulates Quietly Until Someone Maps the Stream
Waste rarely shows up as a single dramatic event. It builds up in small, distributed pockets across the plant that nobody is individually responsible for tracking, which is exactly why it survives audit after audit unnoticed. Each of these five sources tends to be dismissed individually as too small to matter, but added together across a full year of operation they typically account for the majority of a facility's avoidable disposal cost. Expand each item below to see how a proper waste stream mapping exercise, supported by continuous AI monitoring, isolates that specific waste pattern from normal operations.
Trim scrap, punch-outs, and off-cuts are usually swept into a general bin rather than sorted by material grade, which destroys their resale value and hides the true scrap rate of each production line. A waste stream map assigns a source, a material code, and a weight to every scrap stream so it can be tracked line by line instead of disappearing into an undifferentiated dumpster.
Cardboard, stretch film, wooden crates, and foam inserts arrive with nearly every inbound shipment and leave with nearly every outbound one, yet packaging is rarely assigned its own waste category or cost center. iFactory's AI tracks packaging volume against purchase orders and shipment counts to flag suppliers and packaging formats generating disproportionate waste.
Out-of-spec parts are frequently scrapped by default because rework requires a documented deviation process that most quality teams do not have time to run consistently. The platform flags recurring non-conformance patterns and quantifies how much of that material could be reclaimed through a standardized rework or downgrade pathway instead of disposal.
A recycling stream contaminated with the wrong material, even at a small percentage, can cause an entire load to be rejected and rerouted to landfill by the hauler. The AI monitors bin-level contamination patterns and shift-level sorting compliance to identify exactly where and when contamination is being introduced.
Maintenance, repair, and operations inventory quietly accumulates expired lubricants, obsolete spare parts, and unused consumables that eventually get disposed of as hazardous or general waste. iFactory cross-references MRO inventory turns against consumption data to surface overstock before it becomes a disposal line item.
From Waste Stream Mapping to Material Recovery — Four Connected Stages
A credible waste reduction program is not a one-time audit; it is a continuous pipeline that moves material data from the point of generation through to a documented recovery outcome. iFactory's platform runs these four stages in parallel across every waste stream in the facility, so the diversion rate reflects what is actually happening this week rather than what a consultant found during a single site visit last year. Because each stage feeds the next automatically, a change on the floor, such as a new supplier's packaging format or a shift in production mix, shows up in the recovery data within days instead of waiting for the next scheduled audit to surface it.
Waste Stream Mapping
Every waste-generating point on the floor is catalogued by source, material type, and typical volume, creating a live inventory of what is being thrown away and where it originates.
Continuous Volume Tracking
Bin sensors, baler counts, and hauler manifests feed weight and volume data into the platform automatically, replacing estimated waste generation figures with measured ones.
Recovery Pathway Matching
Each material stream is matched against available recycling, reuse, composting, or resale pathways, with the AI ranking pathways by both environmental impact and net cost or revenue.
Diversion Verification and Reporting
Recovery outcomes are verified against hauler and recycler documentation, producing an auditable landfill diversion rate ready for sustainability and compliance reporting.
Landfill Diversion Rate Achieved by Material Category
Not every material stream diverts at the same rate, and knowing which categories are already performing well versus which ones need process changes is essential for setting realistic program targets. The figures below reflect typical diversion rates achieved by material category once a facility has implemented structured source separation and AI-guided monitoring. Metal and cardboard streams tend to reach high diversion quickly because their recovery pathways are well established and widely available, while mixed and contaminated waste requires the most process change before its diversion rate moves meaningfully, which is exactly why contamination monitoring is usually the highest-leverage early investment in any circularity program.
Regulatory Pressure and Rising Disposal Costs Are Making Waste a Board-Level Issue
Waste reduction used to be treated as a housekeeping concern owned by facilities management, but that framing no longer matches reality. Landfill tipping fees have climbed steadily in most regions as available capacity shrinks and municipalities pass the cost of new infrastructure onto commercial generators, which means the same tonnage of waste costs meaningfully more to dispose of every year regardless of anything a plant does differently. At the same time, a growing number of states and countries have introduced extended producer responsibility legislation that requires manufacturers to report, and in many cases fund, the end-of-life handling of packaging and products they place into the market.
Investors and large customers are applying a second layer of pressure through ESG scoring and supplier sustainability questionnaires, many of which now ask for a documented landfill diversion rate rather than a general sustainability statement. A plant that cannot produce an auditable number when a customer's procurement team asks for one risks losing preferred supplier status, independent of how well the plant is actually performing. Circular manufacturing programs built on continuous data collection are increasingly the only practical way to satisfy this kind of request without a scramble every time a new questionnaire arrives, and having that data ready in advance also shortens the sales cycle when a new customer's procurement team runs its own supplier audit.
There is also a straightforward material cost argument that stands on its own even without any regulatory pressure at all. Global commodity and resin prices have been volatile enough in recent years that recovering usable material from scrap, rather than buying virgin material and paying to dispose of the scrap separately, has become a genuine hedge against supply and price risk. Facilities that treat their waste stream as a secondary source of raw material rather than a cost to be minimized are increasingly the ones absorbing input price shocks with the least disruption to production, since a portion of their input material need is already being met internally through recovered scrap and reclaimed packaging rather than a fresh purchase order every time.
Every Tonne Sent to Landfill Is a Tonne You Already Paid to Buy Once
iFactory's AI waste and circularity platform maps your streams, tracks every bin and baler continuously, and hands your team a ranked diversion plan quantified in real dollars and tonnes. Book a demo and see the AI mapping your own facility's waste streams live.
Manual Waste Audits vs AI-Guided Circular Manufacturing
Plants evaluating a move from an annual waste audit to a continuously monitored program need to see the operational difference in concrete terms, not just a percentage promise on a sales sheet. The table below compares the two approaches across the capabilities that most directly affect diversion rate, cost recovery, and compliance readiness, since these are the areas where an annual audit typically falls furthest behind a continuously monitored program.
| Capability | Manual Waste Audit | iFactory AI Circularity Platform |
|---|---|---|
| Waste Tracking Frequency | Annual or quarterly audit walk | Continuous, bin and baler level |
| Contamination Detection | Found only when a load is rejected | Flagged at the source, by shift |
| Recovery Pathway Matching | Based on a single vendor relationship | Ranked across recycling, reuse, resale options |
| Diversion Rate Reporting | Estimated from hauler invoices | Verified and audit-ready in real time |
| Extended Producer Responsibility Readiness | Manually compiled per filing deadline | Continuously updated compliance record |
| Typical Diversion Rate Achieved | 45 to 60 percent | 80 to 90 percent within twelve months |
Quantified Results From Circular Manufacturing Deployments
The figures below reflect measured outcomes from AI-guided waste reduction and circularity deployments across discrete and process manufacturing sites, each tracked over a minimum six-month period and validated against hauler and recycler documentation rather than self-reported estimates, which is why the numbers hold up well when a customer or auditor asks to see the underlying data.
How to Justify a Circular Manufacturing Program to Finance and Operations Leadership
The hardest part of getting a waste reduction program funded is rarely the technology decision; it is convincing finance and operations leadership that the current waste cost is larger and more controllable than the monthly hauler invoice suggests. A credible business case starts by separating the three layers of waste cost described earlier, rather than reporting a single blended disposal figure, because leadership needs to see the material and labor cost embedded in scrap before the savings opportunity becomes obvious. Once that breakdown exists, the case for investment tends to make itself.
The second part of the case is showing a realistic diversion trajectory rather than an aspirational one. Facilities that jump straight to a headline number like ninety percent diversion without first mapping their streams often lose credibility when the number cannot be defended during an audit. A phased plan that shows measured diversion climbing from a baseline in the forty five to sixty percent range up toward eighty percent or higher over twelve months, backed by verified hauler and recycler documentation at each stage, is far more persuasive to a finance committee than a single projected end state.
Finally, it helps to frame the program using the same financial language leadership already uses for other capital decisions: payback period, net avoided cost, and risk mitigation against regulatory exposure. Most facilities that implement structured waste stream mapping and AI-guided recovery pathway matching recoup their program cost from avoided disposal fees and recovered material resale well within the first year, which reframes the initiative from a sustainability line item into a straightforward cost reduction project that happens to also improve the facility's environmental standing.
Your Five-Stage Path to a Zero Waste Manufacturing Program
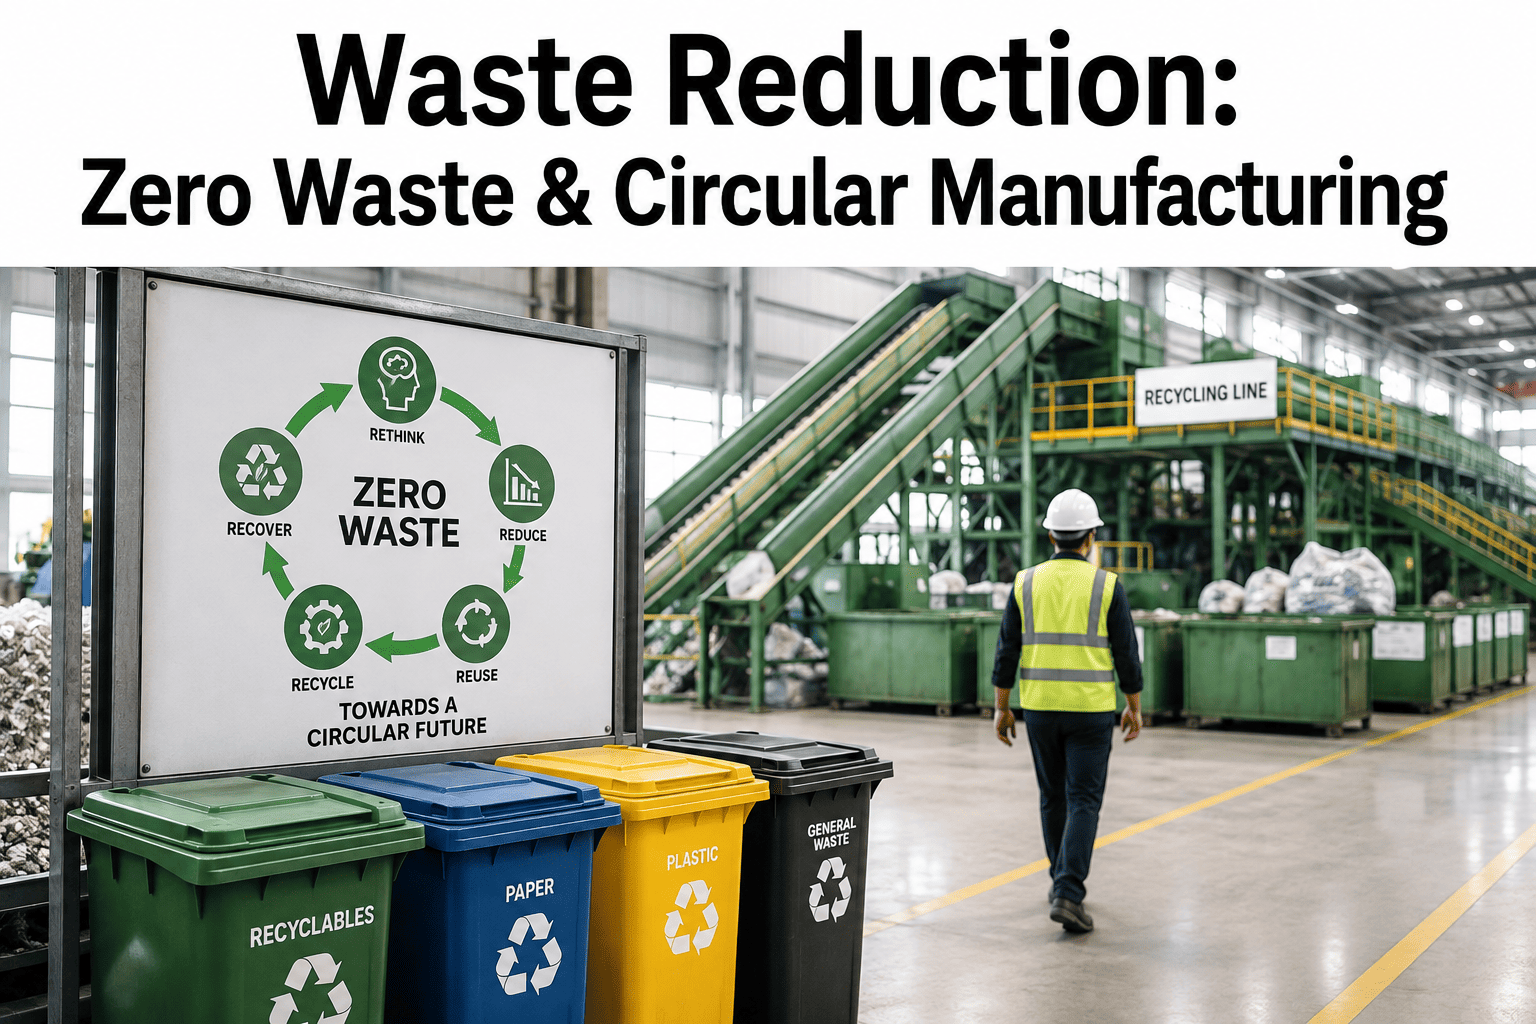
A zero waste commitment does not require a multi-year overhaul to start showing results. iFactory's deployment model is structured in five stages so the first measurable diversion gain typically appears within the first six weeks of onboarding, well before the full facility-wide rollout is complete, which helps sustain internal momentum and leadership support for the later, more involved stages of the program.
Full Waste Stream Audit and Mapping
Every waste-generating source on the floor is catalogued and categorized, establishing a validated baseline diversion rate for the facility.
Source Separation and Bin Standardization
Collection points are redesigned around the mapped streams, with clear material segregation that reduces contamination at the point of generation.
Continuous AI Monitoring Activation
Bin, baler, and hauler manifest data begin streaming into the platform, replacing periodic estimates with measured volume and weight.
Recovery Pathway Negotiation
Recyclers, resellers, and reuse partners are matched against each material stream to maximize recovered value instead of defaulting to a single hauler.
Verified Reporting and Program Expansion
Diversion outcomes are documented for compliance and sustainability reporting, and the program extends to secondary sites using the same validated model.
Common Questions About Zero Waste and Circular Manufacturing Programs
Stop Guessing at Your Diversion Rate and Start Measuring It
iFactory's AI waste and circularity platform tracks every stream continuously, matches materials to the highest-value recovery pathway, and hands your team an audit-ready diversion report. Book a demo and see the AI mapping waste across your own plant in real time.