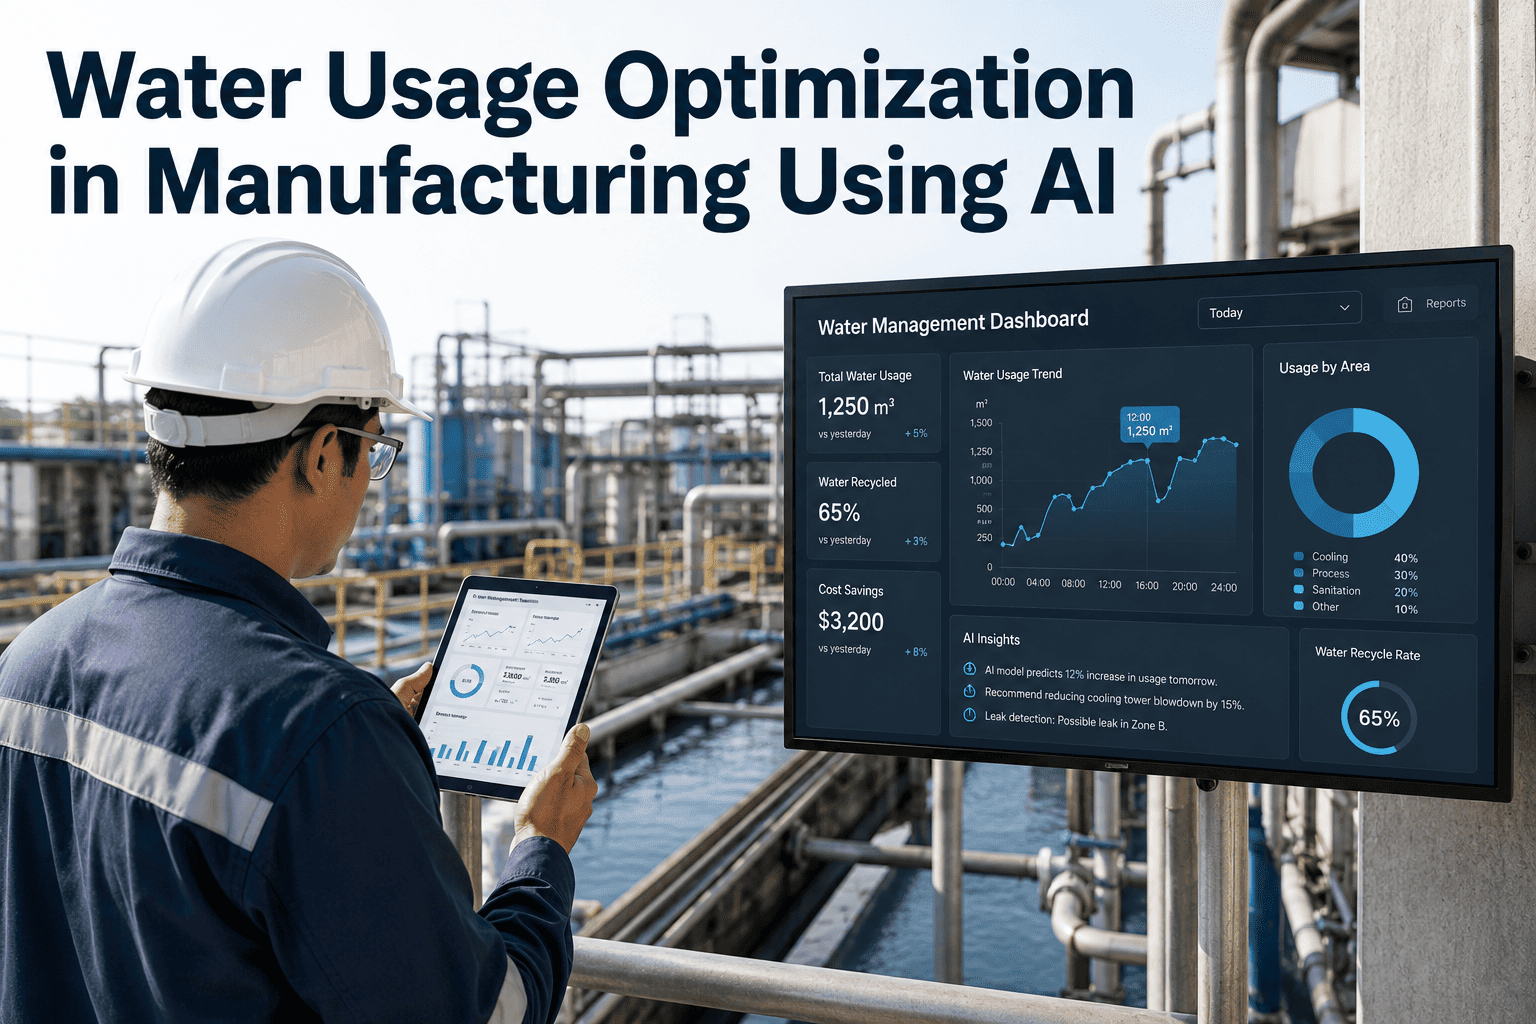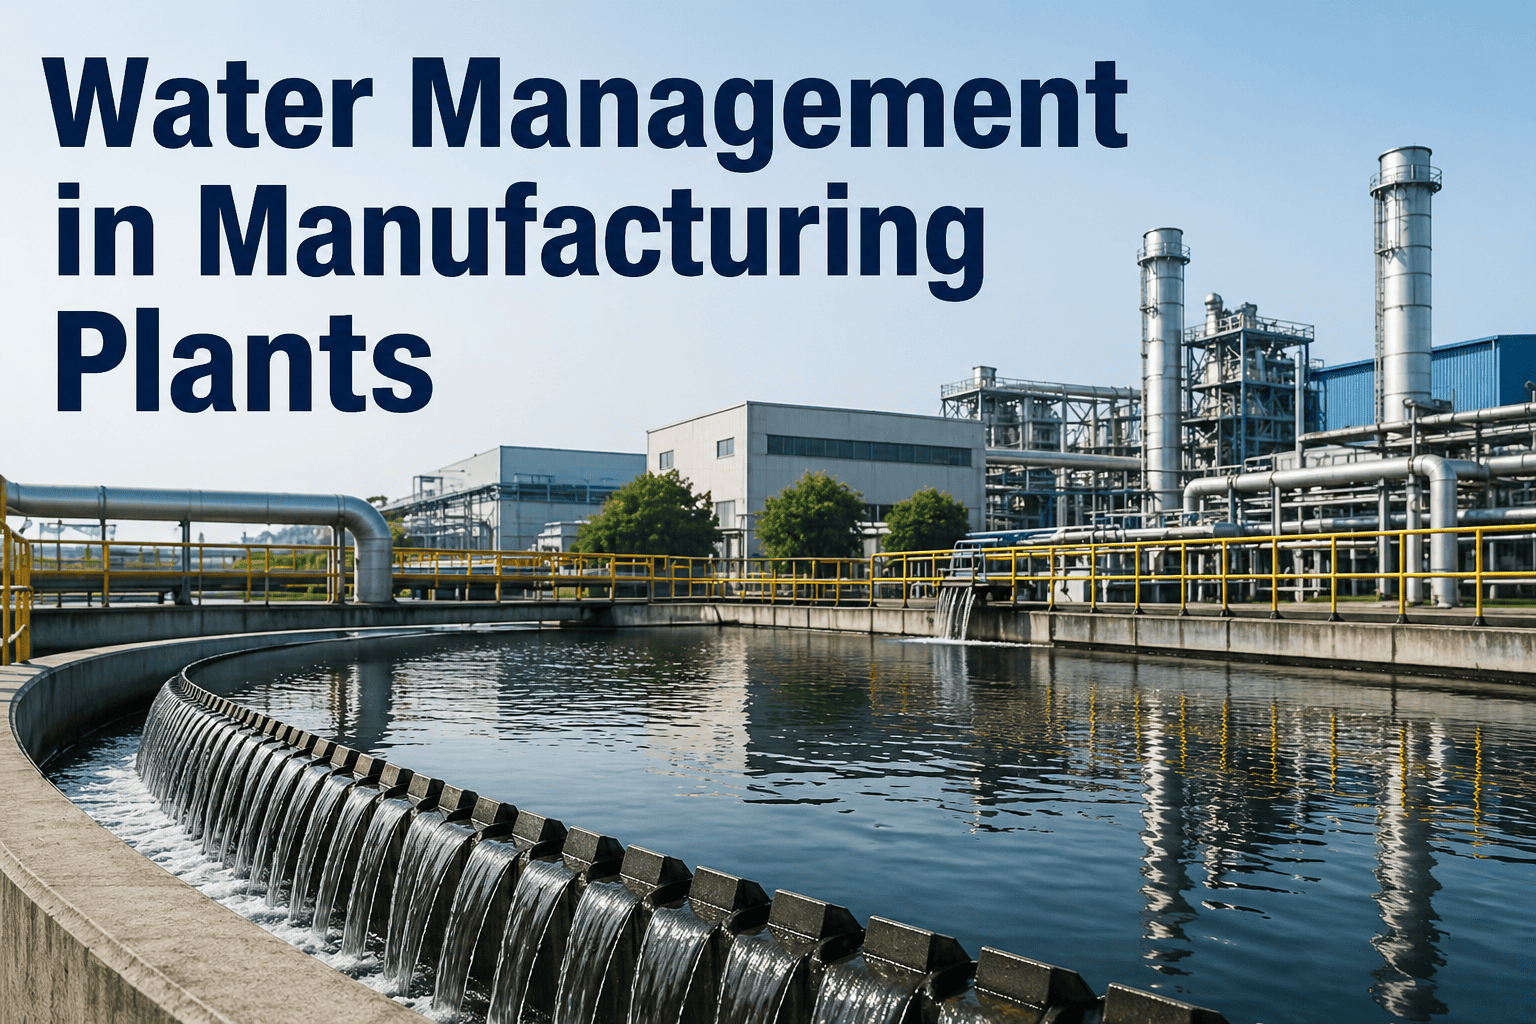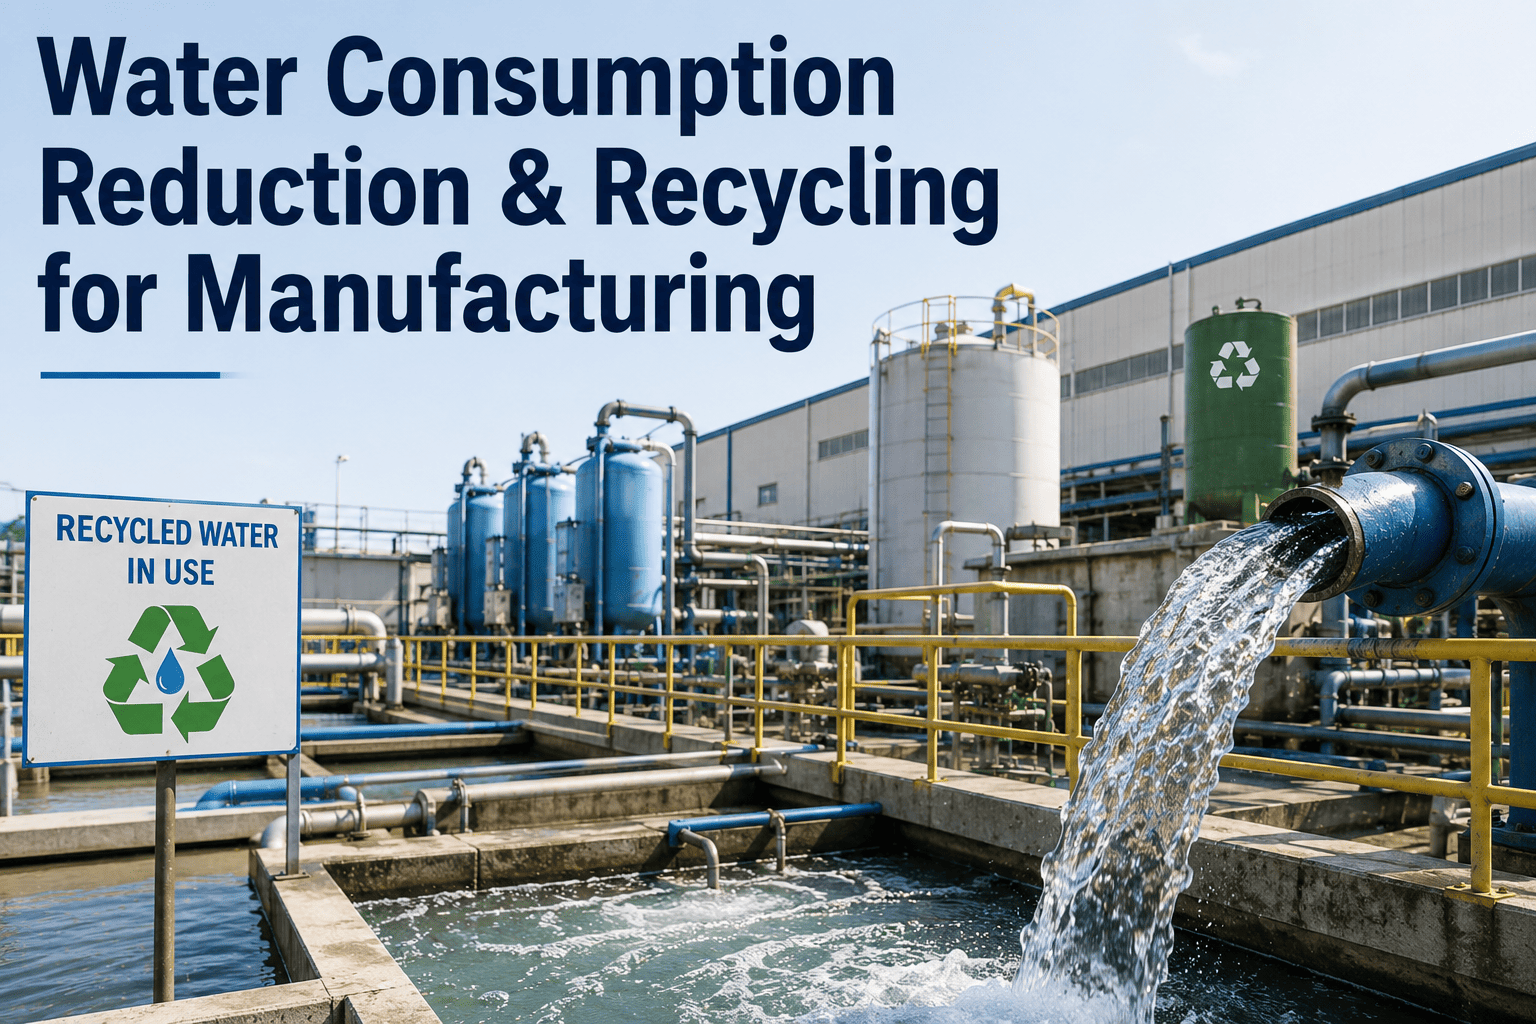
Water rarely shows up as a line item anyone watches closely, yet it flows through cooling towers, wash-down stations, boilers, and process baths in volumes that dwarf most other utility costs once local water and wastewater rates are factored in together. Most plants can tell you their total water bill, but very few can say which process stage consumes the most, where the largest losses happen, or whether a leak has been quietly running for weeks. iFactory's sustainability platform tracks water consumption at the process level so reduction targets are based on measured data, and a short demo can show what that visibility looks like against your own utility meters.
Cut Manufacturing Water Consumption With Data Instead of Guesswork
Water reduction programs stall when nobody can point to which process stage is actually driving consumption. Measuring water use at the source is what turns a general conservation goal into a specific, fundable project.
A Single Water Meter Tells You Nothing About Where Consumption Is Coming From
Most manufacturing sites meter water at the point of entry to the facility and nowhere else. That single number is useful for paying the utility bill but useless for identifying a reduction opportunity, because it blends cooling water, process water, cleaning water, boiler feed, and sanitary use into one undifferentiated total.
| Process Stage | Typical Share of Plant Water Use | Common Reduction Lever |
|---|---|---|
| Cooling towers and heat rejection | 25 to 40 percent | Cycles-of-concentration optimization, blowdown recovery |
| Process and rinse water | 20 to 35 percent | Counter-current rinsing, closed-loop recirculation |
| Cleaning and wash-down | 10 to 20 percent | Automated shutoff, high-pressure low-volume nozzles |
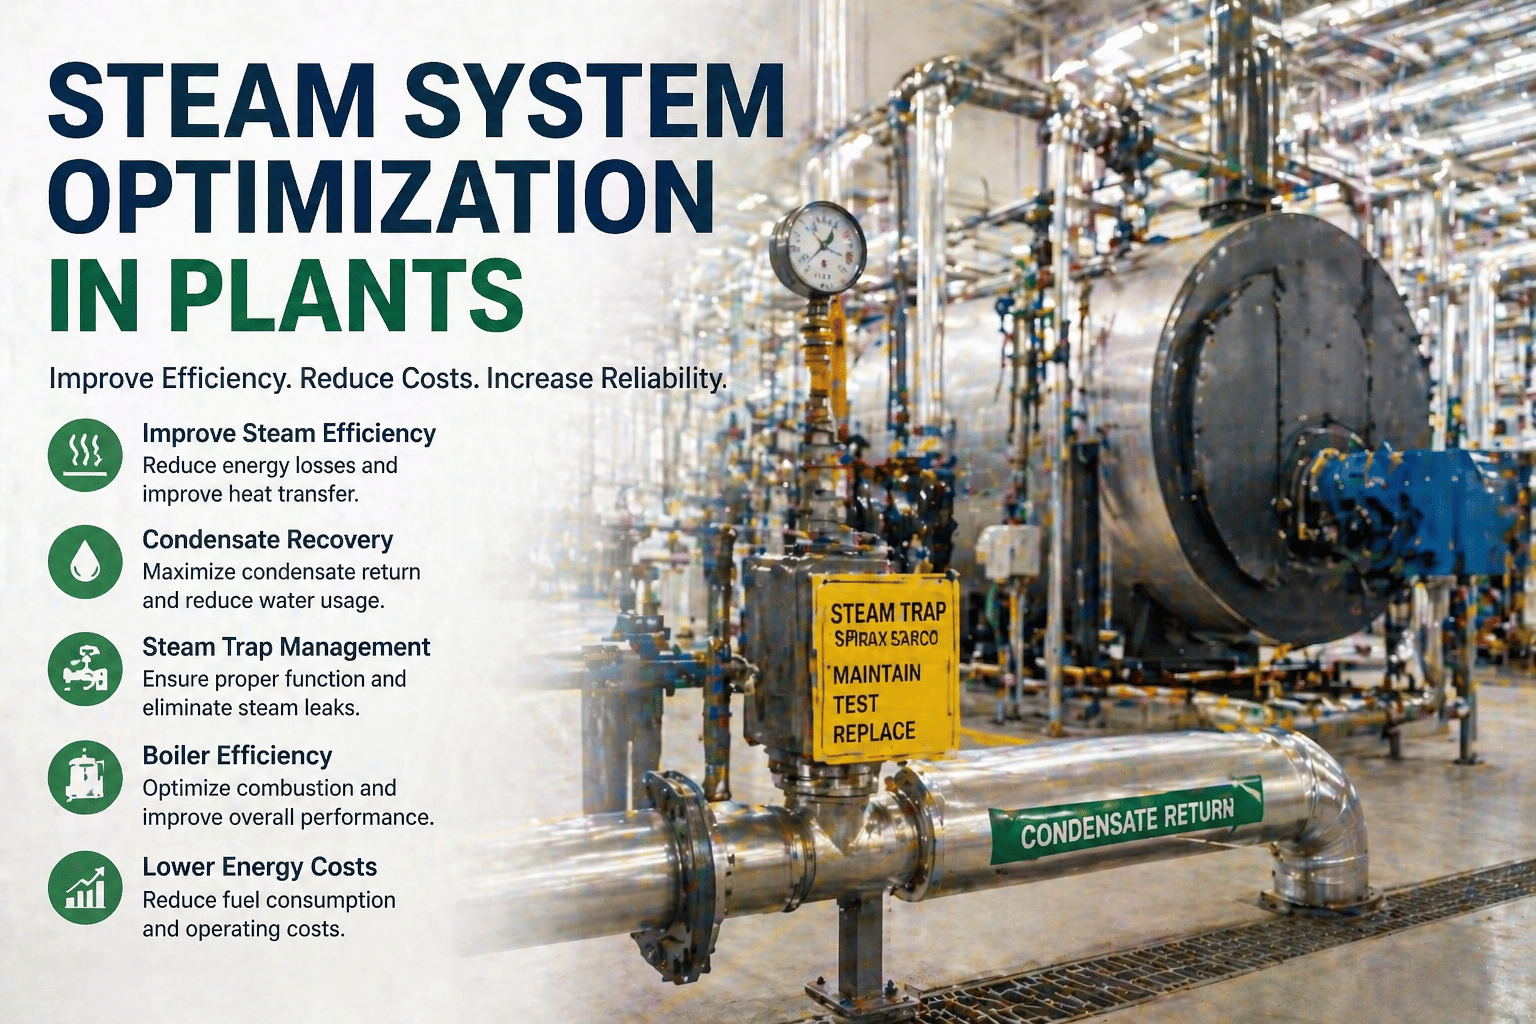
| Boiler feed and steam systems | 10 to 15 percent | Condensate return, blowdown heat recovery |
| Sanitary and general facility use | 5 to 10 percent | Low-flow fixtures, occupancy-based controls |
Five Steps to Build an Accurate Water Footprint Before Setting a Reduction Target
A credible water reduction target has to start from a measured baseline, broken down by process stage, rather than an aspirational percentage applied to the total facility bill.
See Your Own Water Footprint Broken Down by Process Stage
iFactory can map a sample water footprint using your existing meter data and utility bills before you commit to a full sub-metering rollout.
Four Recycling Approaches Ranked by Where They Fit in the Water Cycle
Recycling and reuse projects vary widely in complexity and payback. Matching the right approach to the right water stream is what determines whether a project pays for itself in two years or ten.
| Recycling Approach | Water Stream Targeted | Typical Complexity |
|---|---|---|
| Cooling tower blowdown recovery | Blowdown discharged to maintain cycles of concentration | Low to moderate, often a filtration and pump retrofit |
| Greywater reuse for non-potable needs | Wash-down and rinse water routed to irrigation or flushing | Moderate, requires separate plumbing and basic treatment |
| RO reject water reuse | Reverse osmosis reject from process water treatment | Moderate, depends on reject water quality and end use |
| Rainwater harvesting | Roof and site runoff collected for non-potable process use | Higher upfront cost, storage sizing tied to local rainfall pattern |
Where Most Facilities Find Their First Real Reduction Wins
Why Water Costs More Than the Number on the Utility Bill Suggests
Water reduction projects are often evaluated only against the intake water rate, which understates the real financial case since discharge, treatment, and energy costs ride along with every gallon consumed.
| Cost Component | What Drives It |
|---|---|
| Intake water rate | Municipal or well water charged per unit volume consumed |
| Wastewater discharge fee | Often billed at a similar or higher rate than intake, per gallon discharged |
| On-site treatment cost | Chemicals, filtration media, and labor for pretreatment or RO systems |
| Heating and pumping energy | Energy required to heat process water and move it through the plant |
| Compliance and permitting | Discharge permit monitoring and reporting tied to volume and quality |
What Changed When One Plant Sub-Metered Its Cooling Water Loop
Four Steps to Launching a Water Reduction Program
Common Questions About Manufacturing Water Reduction and Recycling
Turn Water From a Fixed Cost Into a Measured, Reducible One
iFactory helps you sub-meter, baseline, and track water consumption by process stage so every reduction target is backed by real data instead of an estimate.