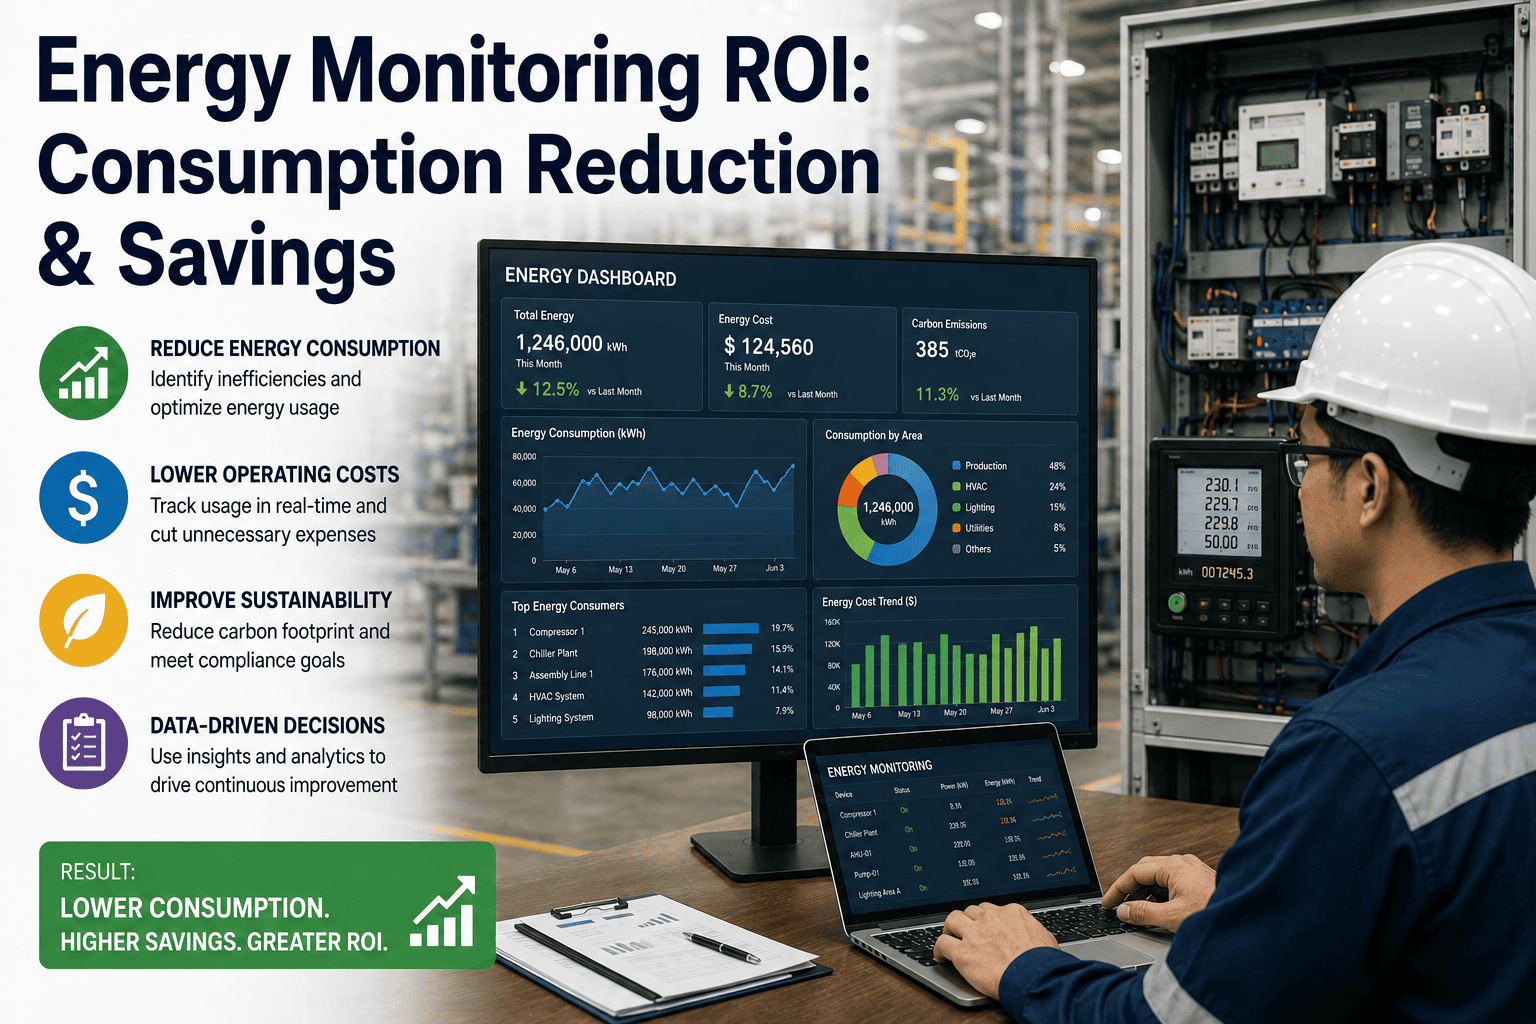
Most manufacturing energy audits are treated as a compliance exercise, filed away once a year with a list of recommendations that never turn into a work order. That habit is expensive. When compressed air, motors, HVAC, lighting, and process heating are examined together as a single connected system rather than five separate checklists, a properly run audit routinely uncovers 15 to 25 percent in identifiable, fundable savings inside a typical plant. The hard part has never been finding waste, it is knowing which finding to act on first, how to size it in dollars instead of vague percentages, and how to verify the fix actually stuck. Book a demo to see how a data-driven audit finds the savings your last walkthrough missed.
Somewhere in Your Plant, One-Fifth of Your Energy Bill Is Being Wasted Right Now
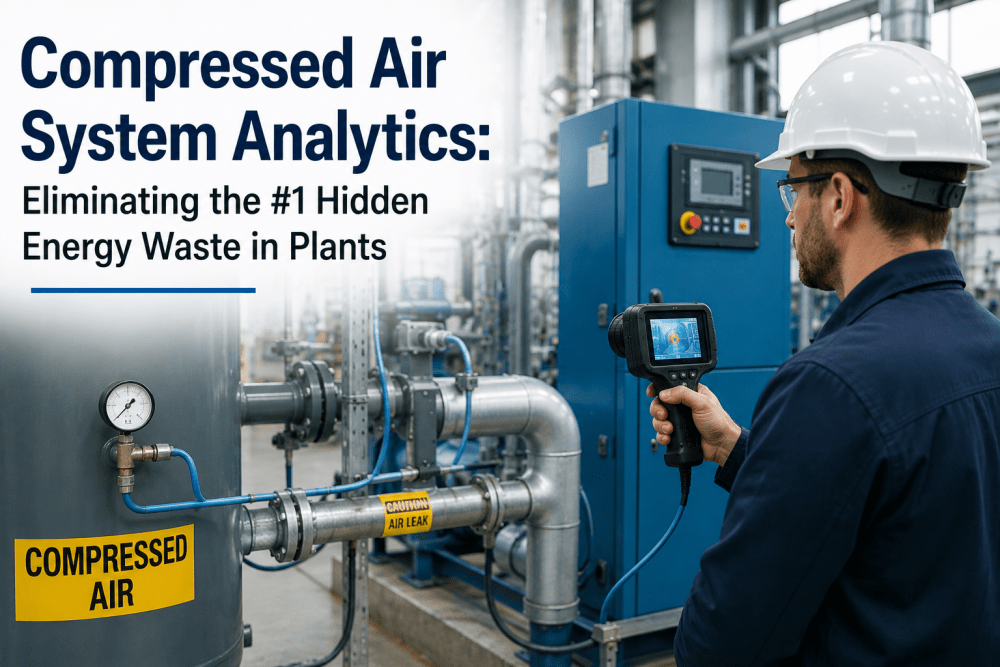
Compressed air leaks nobody can hear, motors running for loads that disappeared years ago, steam traps stuck open, and HVAC running full-tilt over an empty warehouse floor. None of it shows up on a monthly utility bill. iFactory turns a one-time audit into a continuously updated, dollar-ranked action plan so the waste gets fixed instead of filed.
Every Manufacturing Energy Audit Has to Cover Five Zones, Not One
Facilities that audit only one system, usually lighting because it is the easiest to see, capture the smallest available savings and leave the largest opportunities untouched. A complete audit walks through five interconnected zones, each with a distinct waste signature and a distinct fix pattern. The order below reflects how these zones typically rank by dollar opportunity in a mid-size manufacturing facility, not by how easy they are to inspect.
A Breakdown of Where Energy Spend Actually Concentrates in a Typical Plant
Utility bills report one number. They say nothing about which system consumed it. The chart below shows the typical distribution of total facility energy spend once sub-metering and audit instrumentation make the breakdown visible, based on patterns observed across manufacturing facilities of comparable size and process type. Motor-driven equipment dominates the picture because it runs continuously across pumps, fans, compressors, and conveyors, while process heating trails close behind as the second-largest and most frequently under-inspected category.
The practical takeaway is that compressed air, despite generating the largest share of specific, easily-fixed savings opportunities such as leaks and pressure reduction, represents a comparatively modest share of total plant energy spend. Motors and process heating carry the larger dollar totals, which is exactly why an audit limited to compressed air alone leaves the majority of the opportunity on the table.
An Audit Report Is Only Useful If Someone Acts on It
Most audits end with a PDF. iFactory ends with a prioritized, dollar-ranked list of fixes tied directly to the equipment that needs them, so nothing gets lost between the walkthrough and the work order.
Four Stages That Turn a Walkthrough Into a Funded Savings Plan
An energy audit that stops at observation produces a list of impressions, not a plan. A methodology that moves through measurement, financial ranking, and verification produces something an operations team can actually execute against, and a finance team can actually approve. The four stages below describe the sequence that consistently converts audit findings into implemented, verified savings rather than a report that sits unread after the first month.
Typical Savings Range and Payback Period by Energy System
Not every finding deserves the same urgency. The table below summarizes typical savings ranges and payback periods observed across manufacturing energy audits, giving operations and finance teams a shared reference point for sequencing which fixes to fund first and which to plan into a longer capital cycle.
| Energy System | Typical Savings Range | Typical Payback | Capital Intensity |
|---|---|---|---|
| Compressed air leak repair | 15-30% | Under 6 months | Low |
| Compressed air pressure reduction | 3-8% | Under 1 month | Low |
| Motor VFD and right-sizing | 10-20% | 12-24 months | Medium |
| HVAC scheduling and setback | 10-20% | 3-9 months | Low |
| Steam trap survey and repair | 8-15% | 6-12 months | Low-Medium |
| Lighting retrofit and controls | 40-60% of lighting load | 12-18 months | Medium |
The pattern worth noting is that the fastest paybacks, compressed air leak repair and pressure reduction, require almost no capital and can be funded from the maintenance budget rather than a capital request, while the largest single-project savings, motor VFD installation and lighting retrofits, require a business case and a longer approval cycle. Sequencing the zero-capital fixes first builds the internal credibility needed to get the larger projects approved.
Numbers From the Field: What a Typical Audit Actually Finds
The figures below are not theoretical maximums. They represent the range of findings consistently reported across manufacturing energy audits, and they explain why facilities that have never conducted a systematic, instrumented audit tend to find savings at the higher end of every published range.
Five Mistakes That Quietly Erase Audit Savings
A technically accurate audit can still fail to deliver savings if the process around it is broken. These five mistakes appear repeatedly across manufacturing facilities and are almost entirely avoidable with better follow-through rather than more sophisticated measurement equipment.
Common Questions About Manufacturing Energy Audits
How long does a full facility energy audit take from kickoff to a finished action plan?
A comprehensive audit covering all five zones typically takes four to eight weeks from kickoff to a finished, dollar-ranked action plan, depending on facility size and how much metering infrastructure already exists. The baseline and walkthrough stage usually takes one to two weeks, instrumented measurement runs for two to four weeks to capture representative operating conditions across shifts, and the financial prioritization and reporting stage takes another one to two weeks. Facilities with existing sub-metering can compress this timeline significantly since much of the measurement work is already available. Book a demo to scope a timeline for your specific facility.
Do we need to install permanent metering before an audit can begin, or can it start with existing data?
An audit can and should start with whatever data already exists, including twelve to twenty-four months of utility bills, any existing sub-metering, and equipment nameplate data. This existing information is enough to build an initial baseline and identify likely high-opportunity zones through a walkthrough with portable ultrasonic and thermal imaging equipment. Permanent metering is typically recommended only after the walkthrough has identified specific high-value systems that justify continuous monitoring, following the same staged approach used for broader energy monitoring deployments. Contact support to discuss what data your facility already has available.
Which energy system should a facility that has never done an audit tackle first?
Compressed air is almost always the correct starting point because it typically offers the fastest payback and requires the least capital investment of any energy system. An ultrasonic leak survey followed by a leak repair program and a pressure reduction review can be completed within weeks and frequently pays for the entire audit within the first quarter. Steam trap surveys are a close second for facilities with steam systems, since failed traps waste fuel continuously and are inexpensive to identify and repair once flagged. Book a demo to get a prioritized starting point for your facility.
How accurate are the savings percentages an audit reports before the fixes are actually implemented?
When an audit is based on measured data rather than visual estimates, projected savings figures are typically accurate within fifteen percent of the actual reduction confirmed at the twelve-month mark. Accuracy depends heavily on using the facility's own utility cost data and measured consumption rather than generic industry averages, and on a realistic assessment of the facility's current baseline efficiency. Facilities with no prior monitoring history tend to land at the higher end of projected ranges simply because more waste has accumulated undetected. Contact support for guidance on setting a realistic savings baseline.
What happens to audit savings after the first year, do they fade or erode over time?
Savings can and often do erode without a verification mechanism in place, as equipment drifts out of optimal settings, new leaks develop, and operational habits gradually revert to pre-audit patterns. Facilities that treat the audit as a one-time event typically lose a meaningful share of their achieved savings within a few years simply because nothing is tracking whether the fixes are still holding. Continuous monitoring after the initial audit closes this gap by flagging regression as soon as it appears rather than at the next scheduled audit cycle. Book a demo to discuss ongoing verification for your facility.
Stop Guessing Where the Waste Is. Start Measuring It.
iFactory runs a structured, instrumented energy audit across all five zones of your facility and converts every finding into a dollar-ranked action plan your team can actually execute, then keeps measuring to confirm the savings stick.