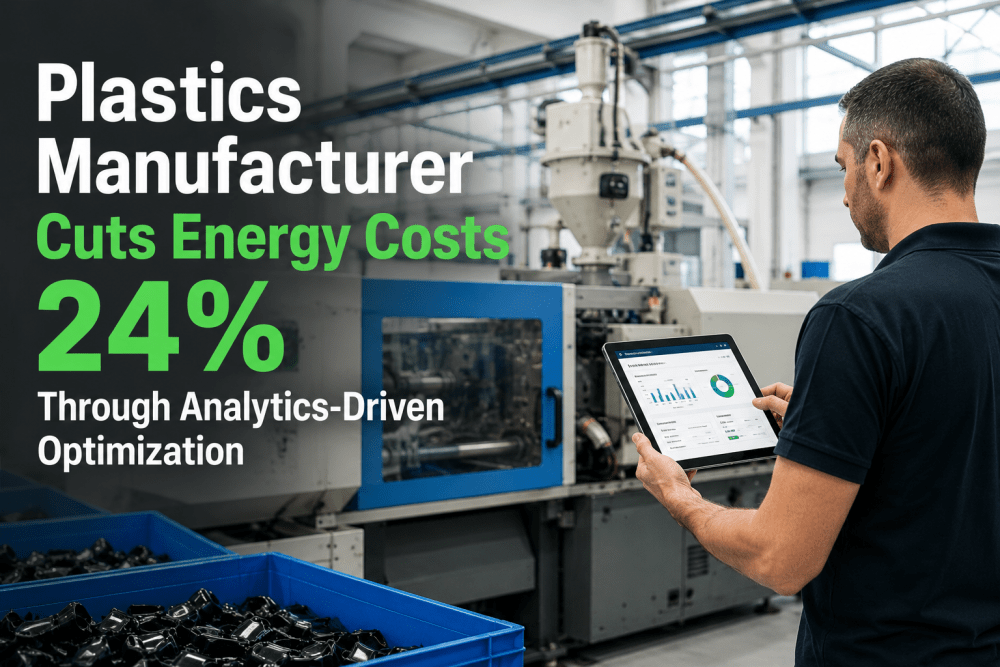
When a mid-sized plastics manufacturer operating 48 injection molding machines across three production shifts faced a 19% year-over-year increase in utility costs, the plant's engineering team recognized that blanket reduction targets would not solve the underlying inefficiency. With electricity consuming nearly 22% of total production costs — driven by hydraulic molding presses, compressed air generation, and process cooling systems — the manufacturer deployed iFactory's Energy & Sustainability Tracking platform to capture granular consumption data at the machine, line, and utility level. Within six months, the analytics-driven approach identified over $340,000 in annual energy waste, reduced plant-wide energy intensity by 24%, and delivered a 3.2-month return on the platform investment. Plastics manufacturing leaders evaluating smart energy management solutions regularly Book a Demo to explore how machine-level energy analytics uncover hidden savings opportunities.
The Hidden Energy Drain in Plastics Manufacturing
Injection molding is among the most energy-intensive processes in discrete manufacturing. Hydraulic pumps run continuously during cycle times, barrel heaters maintain precise melt temperatures, and mold cooling systems operate around the clock. Compounding this baseline consumption, compressed air systems — notorious for undetected leakage — and centralized chillers running at fixed setpoints create a compounding efficiency problem that traditional monthly utility statements cannot diagnose. The plant's existing approach relied on handheld meter readings and manual data logging, capturing only spot-check snapshots that missed the variable load profiles driving the majority of energy consumption.
Injection Molding Overconsumption
Forty-eight presses operating at an average of 62% energy efficiency meant significant waste was embedded in daily production. Manual handheld meter readings captured only spot-check data, missing the variable load profiles that drive 70% of electrical consumption during cycle times. Barrel heater PID oscillation and unmonitored idle power during mold changes were completely invisible to the plant's existing monitoring approach.
Compressed Air System Losses
The plant's 200-hp rotary screw compressor ran at full capacity 24 hours per day, seven days per week. An ultrasonic survey triggered by the analytics platform's pressure decay alerts confirmed 14 undetected leak points across the distribution network, wasting an estimated 38% of total compressed air volume. Without continuous pressure monitoring, these leaks had gone undetected for over a year.
Cooling System Inefficiency
Central chillers maintained a single 45°F supply temperature regardless of individual mold requirements, wasting approximately 15% of chiller energy and creating condensation issues on molds requiring higher coolant temperatures. The fixed-setpoint approach could not adapt to varying production loads, seasonal ambient changes, or mold-specific thermal requirements.
Analytics-Driven Energy Discovery Across the Plant
iFactory deployed wireless sub-meters on each injection molding machine, compressed air drop point, and cooling loop. The real-time dashboard revealed consumption patterns that monthly utility bills could never show — including overnight baseload waste, machine-specific inefficiencies, and shift-level consumption variances that pointed to operator-dependent energy practices. This granular visibility transformed energy management from a monthly accounting exercise into a daily operational discipline. Book a Demo to review the energy analytics dashboard configuration and machine-level monitoring setup.
Machine-Level Energy Profiling — Real-time sub-metering revealed that six aging 500-ton hydraulic presses consumed 40% more energy per cycle than the plant's newer all-electric machines. The platform identified that barrel heater PID loops on three presses were oscillating due to worn thermocouples, causing unnecessary energy spikes during the hold phase. Idle power consumption during mold changes — previously invisible to management — accounted for 11% of total molding energy. By retuning the PID loops and implementing automated idle-mode shutdown protocols triggered by 15 minutes of machine inactivity, the plant reduced injection molding energy consumption by 18%, saving $186,000 annually.
Continuous Leak Detection and Remediation — Continuous pressure and flow monitoring across 23 compressed air drop points identified a recurring pattern of overnight pressure decay that confirmed 14 active leak locations. The platform automatically calculated the financial impact — $47,000 annually in wasted electricity — and prioritized repairs by leak severity grade. The maintenance team eliminated 92% of identified leakage within two weeks by following the platform's severity-ranked repair schedule. Post-remediation monitoring confirmed that the 200-hp compressor could be modulated to 150 hp through variable speed drive control, delivering an additional $8,000 in annual savings.
Dynamic Temperature Setpoint Optimization — The analytics platform mapped chiller load profiles against actual mold temperature requirements for each of the 48 presses, revealing that 60% of molds required significantly lower cooling capacity than the fixed 45°F setpoint provided. By enabling dynamic temperature setpoint control based on real-time mold demand, the plant reduced chiller energy consumption by 22%. Condensation-related quality defects decreased by 34% as a direct result of optimized coolant temperatures matching each mold's specific thermal requirements. The combined cooling savings totaled $62,000 annually.
Measurable Cost and Sustainability Impact
Within six months of deploying iFactory's energy analytics platform, the manufacturer documented verified savings across every major energy-consuming system. The before-and-after comparison below reflects the measured impact of data-driven optimization decisions implemented during the engagement, validated through utility bill reconciliation and production-normalized energy reporting.
How the Energy Analytics Platform Works
iFactory's Energy and Sustainability Tracking module combines hardware-agnostic sensors with AI-driven analytics to deliver actionable energy intelligence across plastics manufacturing operations. The deployment follows a structured four-phase methodology designed for rapid time-to-value.
Sub-Meter Deployment
Wireless energy sub-meters are installed at each machine, compressed air drop, and cooling loop without disrupting production. Data streams continuously to the iFactory cloud platform via encrypted IoT gateways, establishing baseline consumption profiles within 48 hours of installation.
Baseline and Anomaly Detection
The platform establishes consumption baselines per machine and production line using the first 14 days of data. Machine learning models automatically flag deviations indicating waste, leaks, equipment degradation, or operational drift from optimal parameters.
Root Cause Analysis
Drill into specific consumption events with time-correlated production data. The platform identifies whether energy spikes correlate to specific molds, operator shifts, material types, or maintenance events — enabling targeted corrective action rather than blanket process adjustments.
Optimization Playbooks
The platform generates actionable recommendations — from PID loop retuning to chiller setpoint adjustments — and tracks the financial impact of each implemented change. Playbooks are refined continuously as the platform learns from implemented adjustments.
"The energy analytics platform gave us visibility we simply never had. We knew energy was a major cost driver, but we were guessing about where it was actually going. Within the first month, we identified a single 500-ton press with a faulty thermocouple that had been wasting $18,000 per year in excess barrel heating. Multiply that across 48 machines, and the savings become transformative. The 24% reduction in energy intensity we achieved in six months exceeded our first-year target by 60%, and we continue to identify new optimization opportunities through the platform's anomaly detection engine." — VP of Engineering, Plastics Manufacturing Division
The Path to Sustainable Plastics Manufacturing
This case study demonstrates that significant energy optimization in plastics manufacturing does not require capital-intensive equipment replacements. The majority of savings came from identifying and correcting operational inefficiencies that were invisible without continuous, machine-level energy analytics. By deploying iFactory's Energy and Sustainability Tracking platform, the manufacturer achieved a 24% reduction in energy intensity, eliminated 412 metric tons of annual CO₂ emissions, and established a data-driven energy management program that continues to identify new savings opportunities. Quality and sustainability leaders evaluating their energy strategy regularly Book a Demo to explore how analytics-driven optimization can accelerate their cost reduction and sustainability goals.
Frequently Asked Questions
iFactory's platform captures energy consumption at the individual machine, auxiliary equipment, and utility level. Each injection molding press is sub-metered for total power draw, with additional sensors tracking barrel heater load, hydraulic pump consumption, and cooling demand as separate data streams. This granularity enables the platform to isolate energy waste to specific machine subsystems rather than reporting aggregate machine-level data that masks root causes.
A typical deployment for a 40- to 60-machine injection molding facility requires approximately two weeks for hardware installation and platform configuration. The system begins generating actionable insights immediately upon data ingestion, with full baseline establishment occurring within the first 30 days of operation. Production disruption is minimized through wireless sensor deployment that does not require machine downtime or control system modifications.
Yes. iFactory's edge connectors support OPC-UA, Modbus TCP, and MQTT protocols for direct PLC integration. For machines without native industrial network connectivity — common in older hydraulic presses — wireless sub-meters and IoT sensors provide a retrofit path that captures energy data without requiring any PLC modifications or changes to existing control logic.
The platform generates automated energy reports comparing current consumption against established baselines, normalized for production volume and material throughput. Savings calculations follow IPMVP-compliant methodology, with monthly utility bill reconciliation providing third-party validation. Dashboard views are configurable for executive, plant manager, and engineering stakeholder audiences with role-based data access.
Yes. iFactory provides an enterprise dashboard that aggregates energy KPIs across multiple facilities, enabling corporate sustainability and engineering teams to benchmark performance, identify top-performing plants, and propagate best practices. Multi-site deployment is managed from a single console with facility-level role-based access controls ensuring data privacy and appropriate governance.