Most operators have more workover candidates than workover budget, which means the real decision every quarter is not whether to intervene but which twelve wells out of the two hundred on the lease actually deserve the rig time. That ranking is usually built from memory, a few flagging spreadsheets, and whichever engineer shouted loudest in the planning meeting, not from a consistent economic model applied across the full well population. A restimulation candidate that looks obvious on a decline curve can be a poor economic bet once mechanical risk and reservoir remaining potential are actually quantified, while a quiet well nobody flagged can be sitting on the highest incremental return in the portfolio. iFactory's AI ranks every well in your portfolio by expected intervention ROI on the same basis, and you can book a demo to see your own well list ranked by the model.
You Have More Workover Candidates Than Budget — AI Tells You Which Ones Actually Pay Back
iFactory's AI scores every well in your portfolio against decline behavior, mechanical condition, remaining reservoir potential, and intervention cost, then ranks them by expected return so your next rig slot goes to the well that earns it.
Ranking Workover Candidates by Instinct Leaves Real Money on the Table Every Budget Cycle
Intervention planning meetings are usually built around the wells that are top of mind, not the wells with the strongest economics, because nobody has time to run a full return calculation across an entire portfolio by hand every quarter. The result is a shortlist shaped by recency and squeaky-wheel visibility rather than a consistent view of where the next dollar of workover budget actually earns the most.
Four Factors iFactory's AI Weighs Before Ranking a Well for Intervention
A credible candidate ranking has to combine reservoir, mechanical, and economic information into a single comparable score, which is exactly what a spreadsheet decline review cannot do consistently across a large well count.
Actual production is compared against the well's own type curve and offset analogs to isolate wells declining faster than reservoir depletion alone would explain, the clearest early signal of a mechanical or near-wellbore issue worth fixing. This comparison alone filters out a large share of candidates that simply look tired on a raw production plot but are actually behaving exactly as their reservoir predicts.
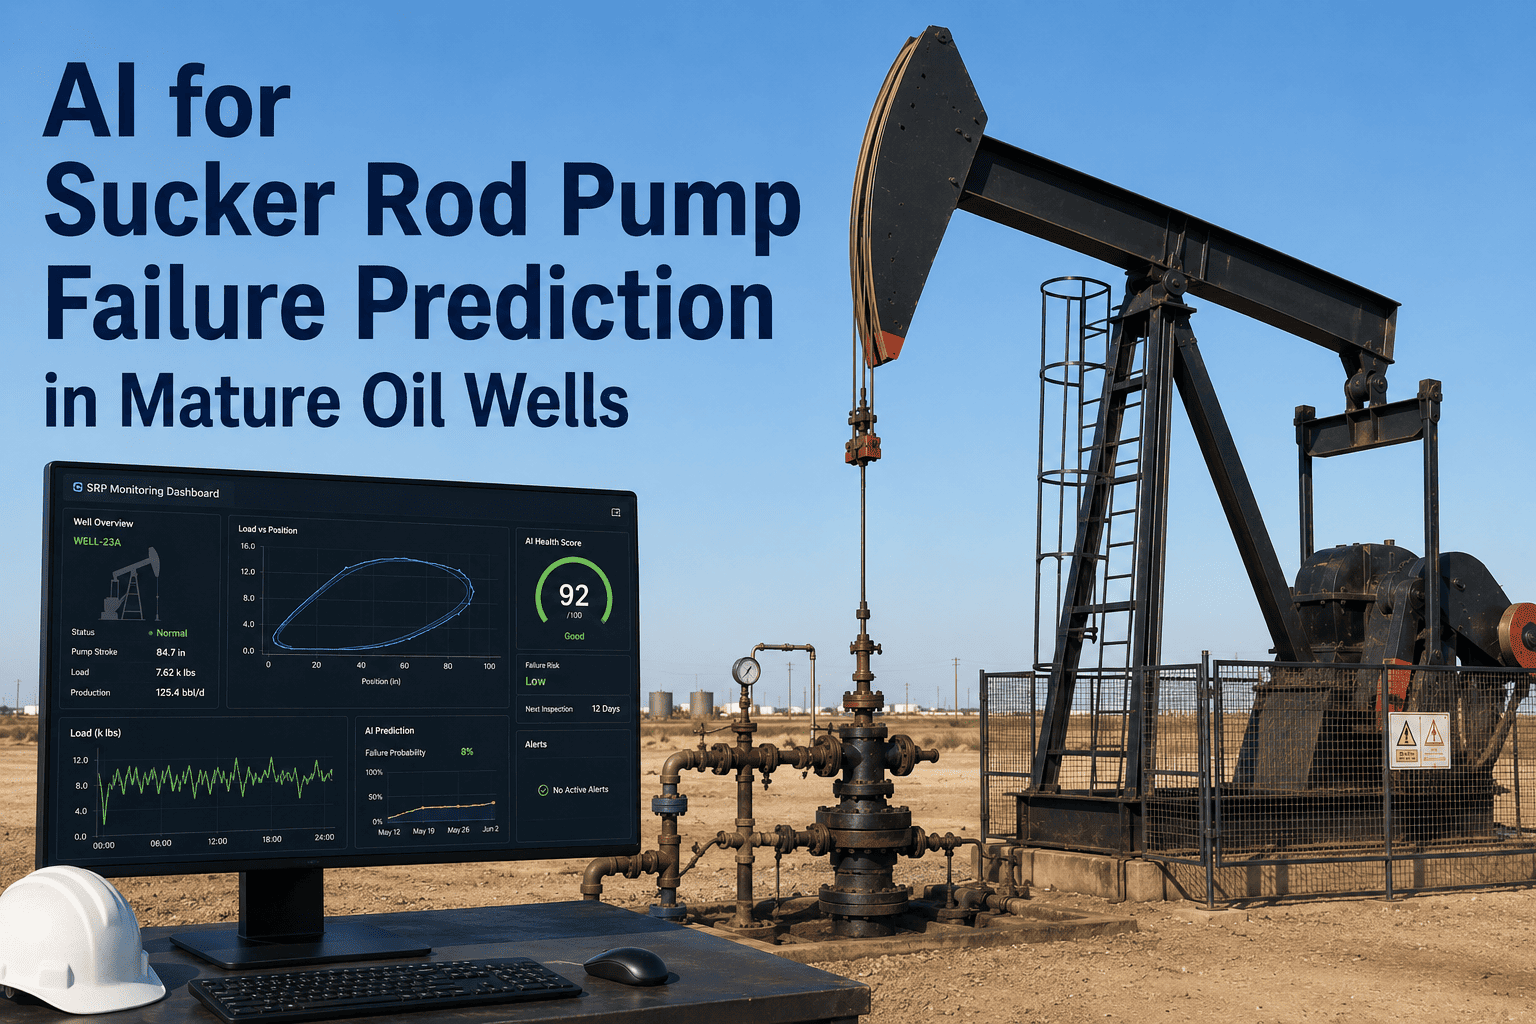
Pump cards, gas lift valve performance, casing pressure trends, and failure history are weighed together to flag wells where a mechanical fix alone would restore meaningful rate without any reservoir stimulation at all.
Material balance and offset depletion trends estimate how much recoverable resource actually remains behind pipe or undrained near the wellbore, filtering out wells that look active but are simply running out of reservoir to produce.
Estimated workover, recompletion, or stimulation cost is weighed against projected incremental production and current commodity price to produce a single expected payback period the whole team can compare across candidates.
From Raw Well Data to a Single Ranked List — the Scoring Sequence
Score Every Well on the Same Basis
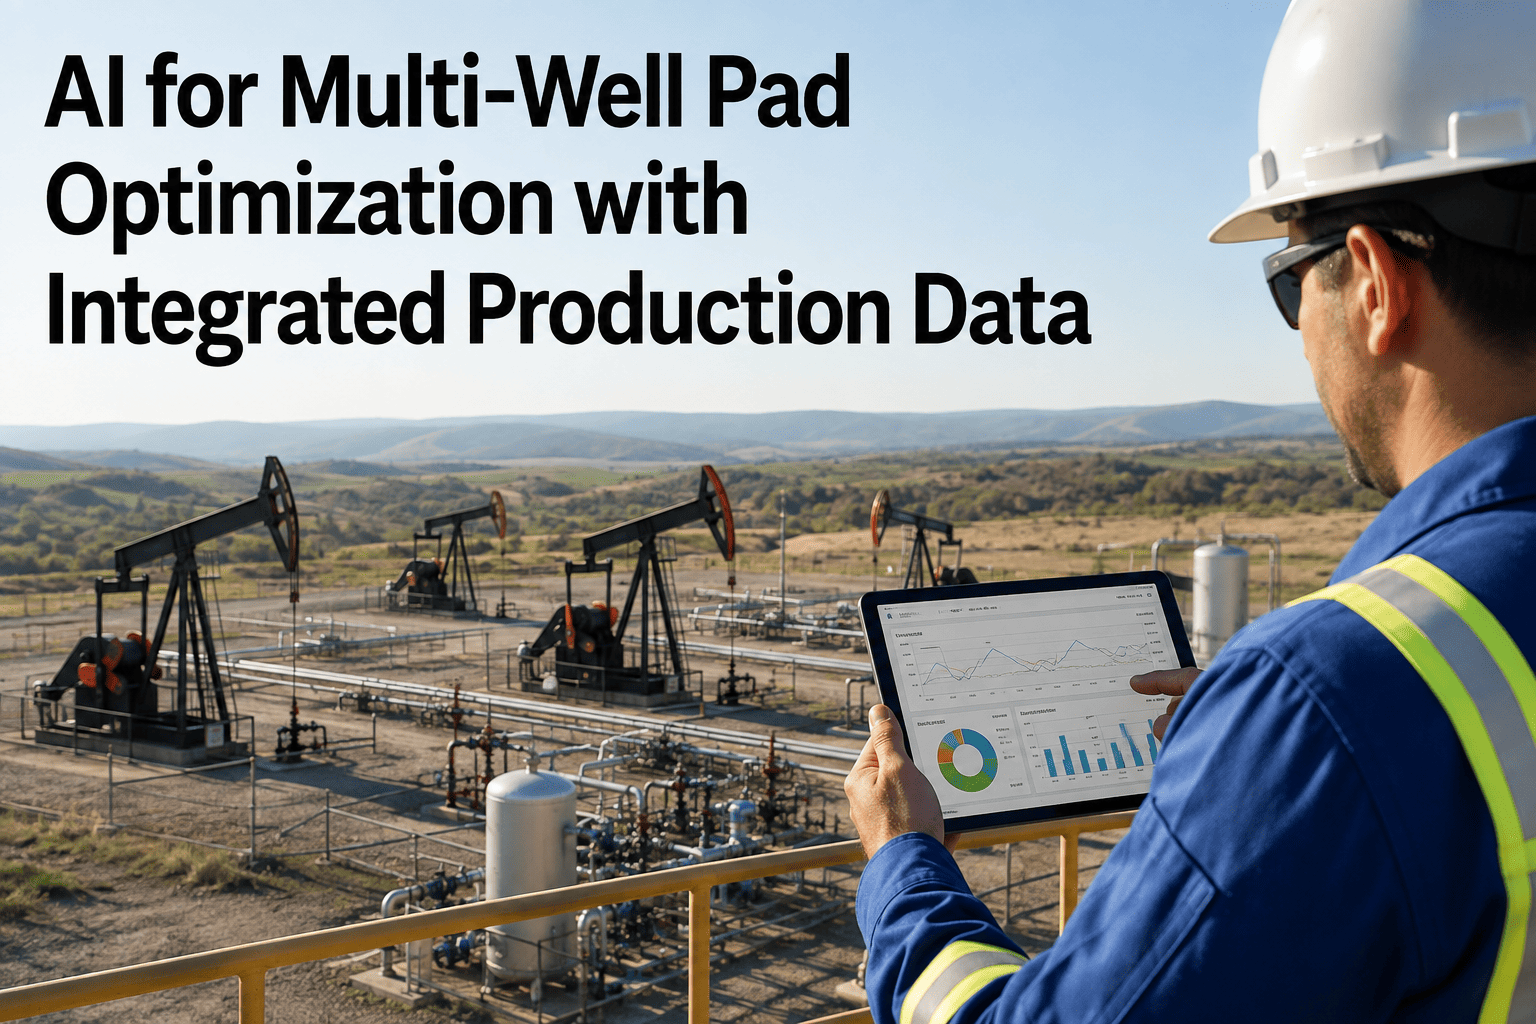
Every active well in the portfolio is scored against the same decline, mechanical, and reservoir criteria, removing the selection bias that comes from only reviewing wells someone already flagged. This full-population approach is what surfaces the quiet, underperforming wells that never make it onto a manually built shortlist.
Match Candidates to Intervention Type
Each scored well is matched against the intervention type most likely to address its specific limiter, whether that is a workover, recompletion, artificial lift change, or restimulation.
Rank by Expected Return
Candidates are ranked by projected incremental production against estimated intervention cost, producing a single ordered list rather than several disconnected shortlists from different disciplines.
Update as New Data Arrives
Rankings refresh automatically as new production, pressure, and cost data comes in, so a budget cycle six months from now is not working from a stale list.
Stop Ranking Candidates From Memory
See how your current shortlist compares to a full portfolio ranked on the same economic basis. Book a demo and bring your next intervention list.
Which Intervention Type Fits Which Well — A Quick Reference
Not every underperforming well needs the same fix, and matching the right intervention to the right root cause is where a large share of workover budget is either well spent or wasted. The table below summarizes how the AI typically routes wells by their dominant limiter.
| Dominant Limiter | Typical Intervention | Expected Payback |
|---|---|---|
| Artificial lift inefficiency | Pump or gas lift optimization change | 1 to 3 months |
| Near-wellbore skin or damage | Acid or mechanical workover | 3 to 6 months |
| Depleted fracture conductivity | Restimulation | 6 to 12 months |
| Bypassed reservoir behind pipe | Recompletion to new zone | 4 to 9 months |
Outcomes Reported After Adopting AI-Ranked Intervention Planning
The figures below reflect results tracked across operators after replacing instinct-based candidate selection with AI-ranked intervention planning across their existing well portfolio, measured over multiple budget cycles against each operator's own prior selection process.
Your Path From Well List to Ranked Intervention Plan
Load the Portfolio
Production history, mechanical data, and completion records for your active wells are connected and normalized into the scoring model.
Calibrate Scoring Weights
Decline, mechanical, reservoir, and cost weightings are tuned against your basin and historical intervention outcomes.
Generate the Ranked List
Every well receives a comparable score and recommended intervention type, ready for the next budget planning cycle.
Track Actuals Against Plan
Post-intervention results feed back into the model, sharpening its accuracy on your specific asset with every completed job.
Questions Asset Teams Ask About AI-Ranked Intervention Selection
Your Best Workover Candidate Might Not Be the One Anyone Remembered to Flag
Workover and intervention budgets are finite, but the number of wells that could theoretically benefit from some kind of fix is not, which means the entire value of a planning cycle rests on getting the ranking right rather than the execution. A shortlist built from memory and a handful of decline plots will always miss quiet, high-potential wells sitting outside anyone's immediate attention.
iFactory's AI applies the same scoring discipline across your full portfolio every cycle, weighing decline behavior, mechanical condition, remaining reservoir potential, and cost together so the wells at the top of the list are there because the numbers support it, not because they were the loudest problem in the room. Over successive budget cycles, that discipline compounds: each completed intervention feeds actual results back into the model, sharpening its accuracy on your specific basin and well population rather than resetting to a generic industry average every time.
Bring Your Next Candidate List and See It Reranked by the Numbers
iFactory's AI scores your entire well portfolio on a consistent economic basis, so your next rig slot goes to the well that earns it. Book a demo and walk through your own portfolio.