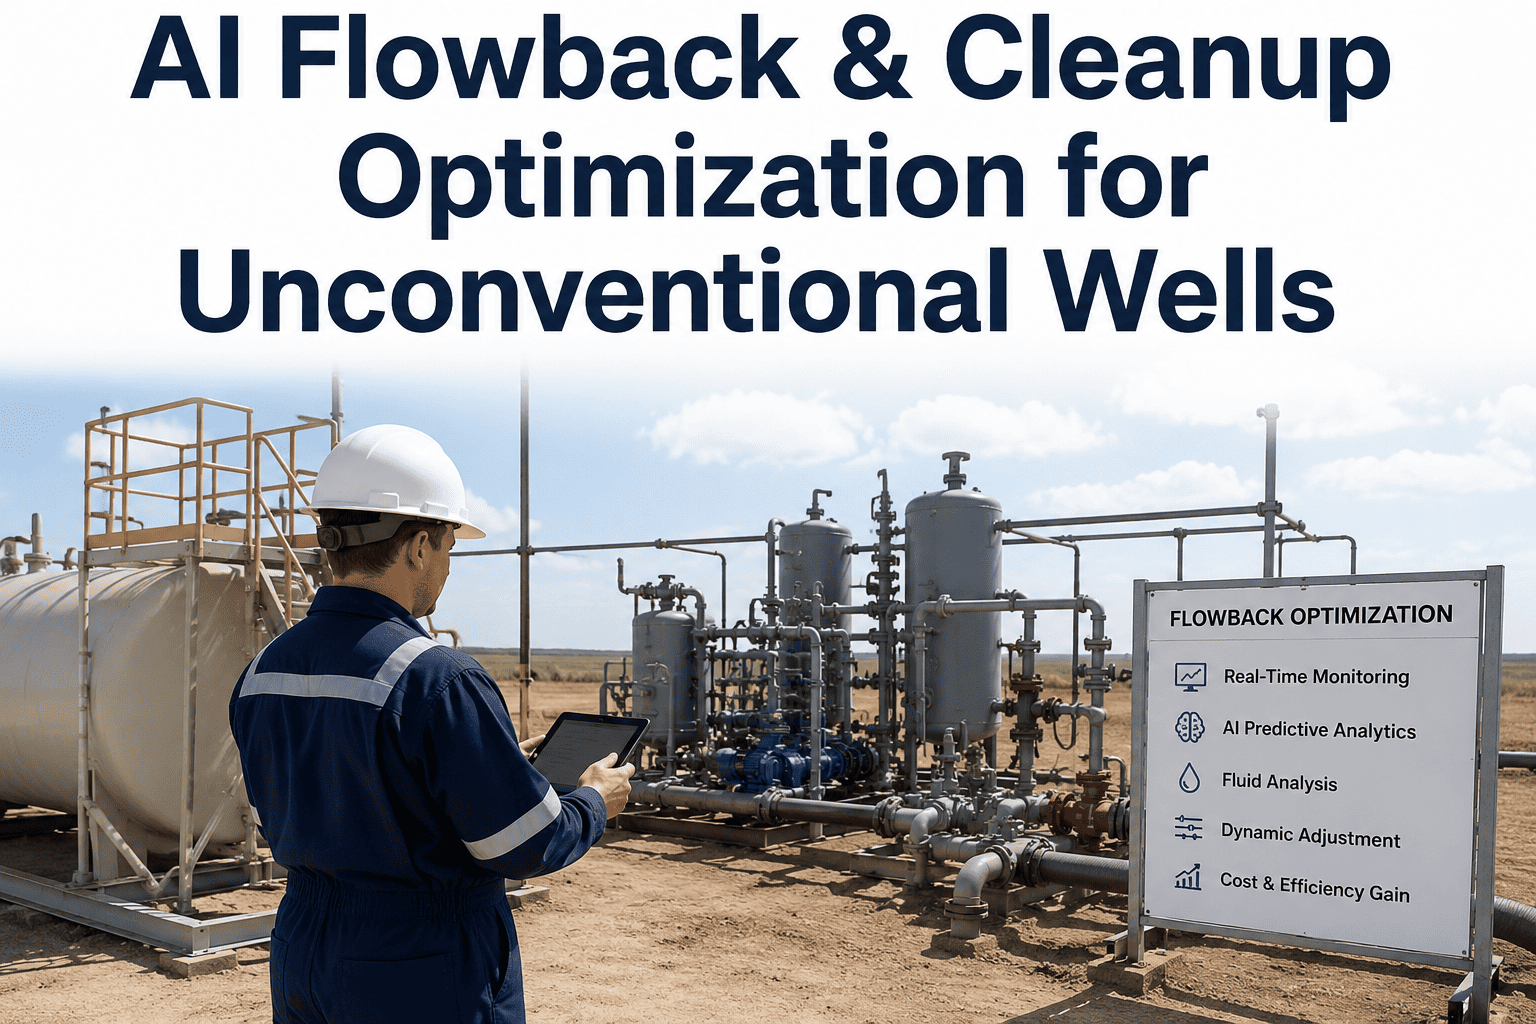
The first 72 hours after a frac crew leaves location often decide how a well performs for the next ten years, yet flowback is still frequently managed with a printed choke chart and an operator's gut feel about when to open the next bean size. Ramp the rate too fast and you risk collapsing the near-wellbore proppant pack or screening out the very conductivity you paid to create; ramp it too slow and frac fluid sits in the formation longer than necessary, delaying cleanup and deferring first production. Every choke change, every psi of casing and tubing pressure, and every barrel of load fluid recovered is a data point that either protects or undermines the well's long-term productivity. iFactory's AI-powered flowback and cleanup optimization platform reads that data continuously instead of on a clipboard, and you can book a demo to see it running against your own flowback history.
Every Choke Change During Flowback Is a Bet on the Well's Future — AI Makes Sure the Odds Favor You
iFactory's AI continuously reads casing pressure, tubing pressure, choke position, sand counts, and fluid recovery to recommend the choke schedule that protects the proppant pack, shortens cleanup, and gets the well to a stable, sustainable rate faster.
A Rushed or Overly Cautious Flowback Schedule Quietly Costs You Production for Years, Not Days
Flowback decisions are usually made under time pressure, with completions crews waiting to move to the next pad and a wellsite team relying on a static choke chart that was written before the well was even drilled. The numbers below reflect what that pressure typically costs across unconventional operators.
Four Signals iFactory's AI Tracks Simultaneously Through Every Stage of Flowback
A choke chart treats every well the same. iFactory's AI treats every well as its own system, correlating the signals below against the specific reservoir, completion design, and offset well history of that exact wellbore rather than a generic type curve.
The AI compares the rate of pressure decline against a formation-specific tolerance threshold derived from completion design and offset performance, flagging any choke change that risks exceeding safe drawdown before it happens rather than after sand shows up at surface.
Surface sand detectors and sample-catch data are trended continuously so a rising proppant return curve is caught within hours, not discovered at the next scheduled site visit when the damage is already done.
Cumulative recovered volume is tracked against pumped volume in real time, giving the team an evidence-based view of true cleanup progress instead of an assumption based on how many days have passed since frac.
The AI watches for the point where produced fluid composition flattens into a stable trend, the clearest signal that the well has genuinely cleaned up and is ready to move to a sustained production choke setting.
From Live Wellhead Data to a Recommended Choke Move — the AI Flowback Loop
iFactory's platform runs a continuous decision loop rather than a one-time analysis, updating its recommendation every time new pressure, rate, or fluid data arrives from the wellsite.
Ingest Live Wellhead Data
Casing and tubing pressure, choke position, temperature, and separator readings stream in from the wellsite at short intervals, normalized against the well's specific completion and reservoir profile.
Model Safe Drawdown Envelope
The AI calculates a dynamic safe-drawdown envelope for the current stage of cleanup, factoring in proppant type, fracture geometry, and how nearby wells behaved during their own flowback period.
Compare and Flag Deviation
Actual choke behavior is checked against the envelope continuously, and any move that would breach the safe zone, or any cleanup metric that has plateaued past the point of needing further caution, is flagged immediately.
Recommend the Next Choke Move
The team receives a specific, ranked recommendation for the next bean size and timing, along with the reasoning behind it, so field decisions are documented and defensible rather than improvised.
Your Choke Chart Doesn't Know This Well. iFactory's AI Does.
Stop applying a generic flowback schedule to a wellbore with its own specific reservoir and completion characteristics. Book a demo and see how the AI would have handled your last three completions.
Choke-Chart Flowback vs AI-Guided Flowback — What Actually Changes
The table below sets the two approaches side by side across the decisions that most directly affect long-term well productivity and near-term cleanup cost.
| Decision Point | Static Choke Chart | iFactory AI Flowback |
|---|---|---|
| Rate-Up Schedule | Fixed bean sizes on a preset time interval regardless of well behavior | Dynamic schedule adjusted to this well's actual pressure and sand response |
| Proppant Flowback Response | Detected after visible sand accumulation at surface equipment | Flagged from early trend deviation before sand reaches surface |
| Cleanup Duration Decision | Fixed number of days regardless of actual fluid recovery progress | Ends when fluid composition and recovery data confirm true stabilization |
| Documentation of Decisions | Handwritten notes on a choke chart, rarely reviewed after handover | Every recommendation logged with the data that supported it |
Outcomes Reported From AI-Guided Flowback Programs on Unconventional Pads
The figures below reflect results tracked across multiple operators after adopting AI-guided flowback management on horizontal unconventional completions, compared against each operator's own prior choke-chart baseline.
Getting AI-Guided Flowback Running on Your Next Pad
Flowback optimization does not require a lengthy integration project. iFactory's deployment model is built to be running before your next completion crew mobilizes off the pad.
Connect Wellhead Data
Existing pressure gauges, choke controllers, and separator instrumentation are connected without requiring new hardware in most cases.
Calibrate to the Well
The AI builds a well-specific drawdown envelope using completion design, reservoir data, and offset well flowback history.
Run Live Recommendations
The wellsite team receives ranked choke recommendations through the flowback window, with full reasoning attached to each one.
Review and Refine
Post-cleanup performance is reviewed against the recommendation log so the model keeps improving on your specific asset over time.
Questions Completions and Production Teams Ask About AI-Guided Flowback
Flowback Is a One-Time Window. Don't Manage It With Yesterday's Chart.
Every unconventional well gets exactly one flowback period, and the decisions made across those first two weeks shape fracture conductivity and cleanup cost for the rest of the well's producing life. A static choke chart cannot see the specific reservoir, completion design, and real-time signals that actually determine whether this well is ready for the next rate step, which is precisely the gap iFactory's AI is built to close.
By reading casing pressure, sand returns, and fluid recovery continuously and comparing them against a well-specific safe drawdown envelope, the platform gives completions and production teams a defensible, data-backed choke recommendation at every stage instead of a generic schedule. Operators using this approach are protecting more fracture conductivity, shortening unnecessary cleanup time, and documenting every decision along the way.
See What AI-Guided Flowback Would Recommend on Your Last Completion
iFactory's AI turns your existing wellhead data into a continuous, well-specific choke recommendation engine built to protect conductivity and shorten cleanup. Book a demo and walk through it against your own well data.