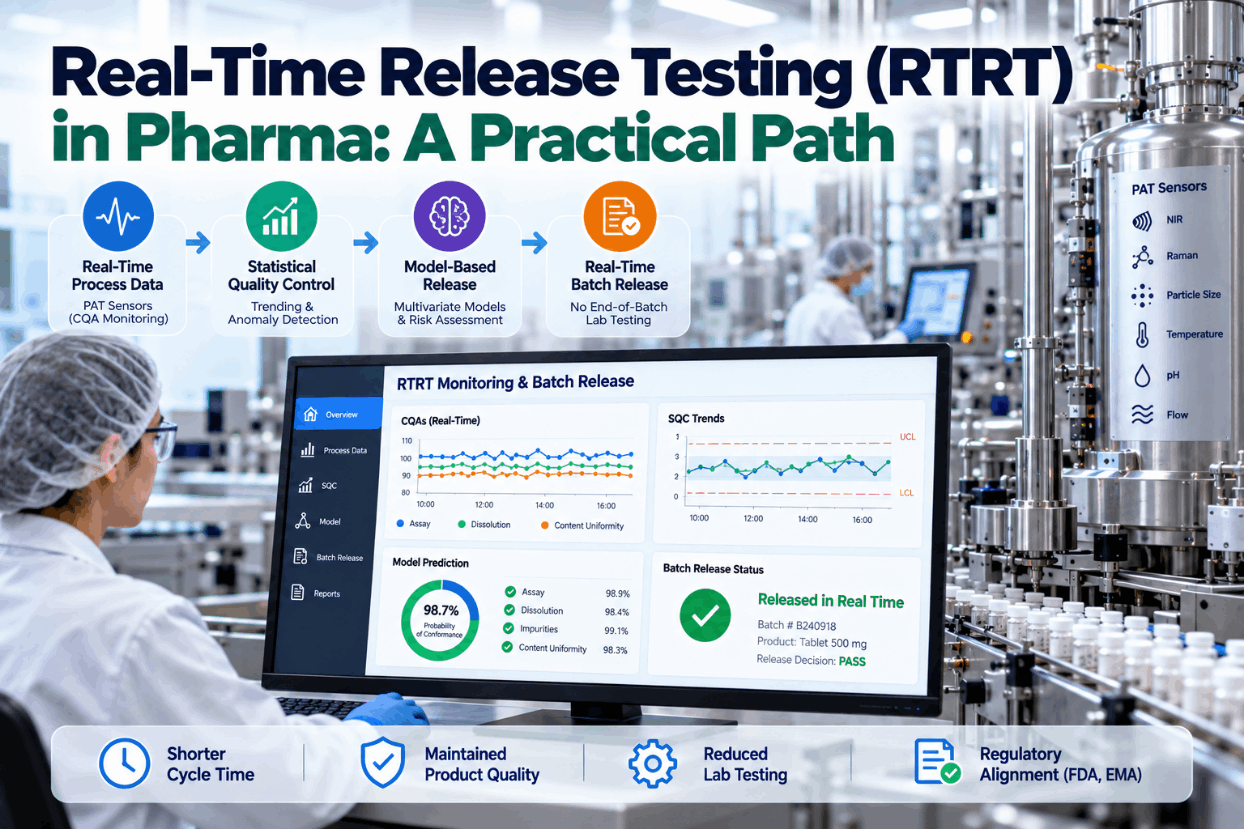
In most pharma plants, a finished batch waits. It is made, sampled and then held while the lab runs end-product tests, results are reviewed and the release decision is signed. Real-time release testing changes that by using process data and in-line measurements, gathered while the batch is made, to show that quality attributes are met. It is not a shortcut. It takes validated models, strong process control and regulatory approval. But where it fits, it cuts release lead time sharply and gives far more insight into every batch. This guide covers what RTRT is, its regulatory basis, the building blocks, a practical implementation path and how to keep models trustworthy. To discuss an RTRT roadmap for your product, book a short walkthrough.
Real-Time Release Testing (RTRT) in Pharma: A Practical Path From Lab Release to Process Release
PAT measurements, process data, predictive models and SQC combined into a release decision you can defend, without waiting days for end-product tests.
Why Batches Wait for Release
Release lead time is one of the largest hidden costs in pharma manufacturing. Industry benchmarks compiled by IntuitionLabs put typical release times for medium-complexity products at 12–18 days or longer, against 3–5 days for the best sites with standard products. During that time, finished product sits in quarantine, inventory is tied up and any problem found in the lab arrives long after the process that caused it.
End-product testing also sees very little. A handful of tablets from a batch of hundreds of thousands tells you those tablets passed. It says nothing about the variation during the run. In-line measurements and process data, by contrast, see the whole batch as it is made.
RTRT uses that richer data as the basis for release. It is demanding to set up, but it changes release from waiting to confirming. We can look at your release lead times on a call.
What RTRT Is and What Regulators Expect
RTRT has been part of the regulatory framework for more than a decade. It is well defined, but it must be approved for each product before it is used.
One point often surprises teams: under the EMA guideline, a failed RTRT result cannot simply be overruled by running the traditional test instead. That makes model robustness and control strategy critical. Our specialists can walk through the implications.
The Components of an RTRT Control Strategy
RTRT is not a single instrument. It is a control strategy made of several parts that together give confidence in every batch.
Incoming materials characterized, often with NIR identity and property checks.
In-line or at-line tools such as NIR and Raman measure attributes during processing.
Critical parameters held inside a proven design space.
Models estimate attributes such as assay, content uniformity or dissolution.
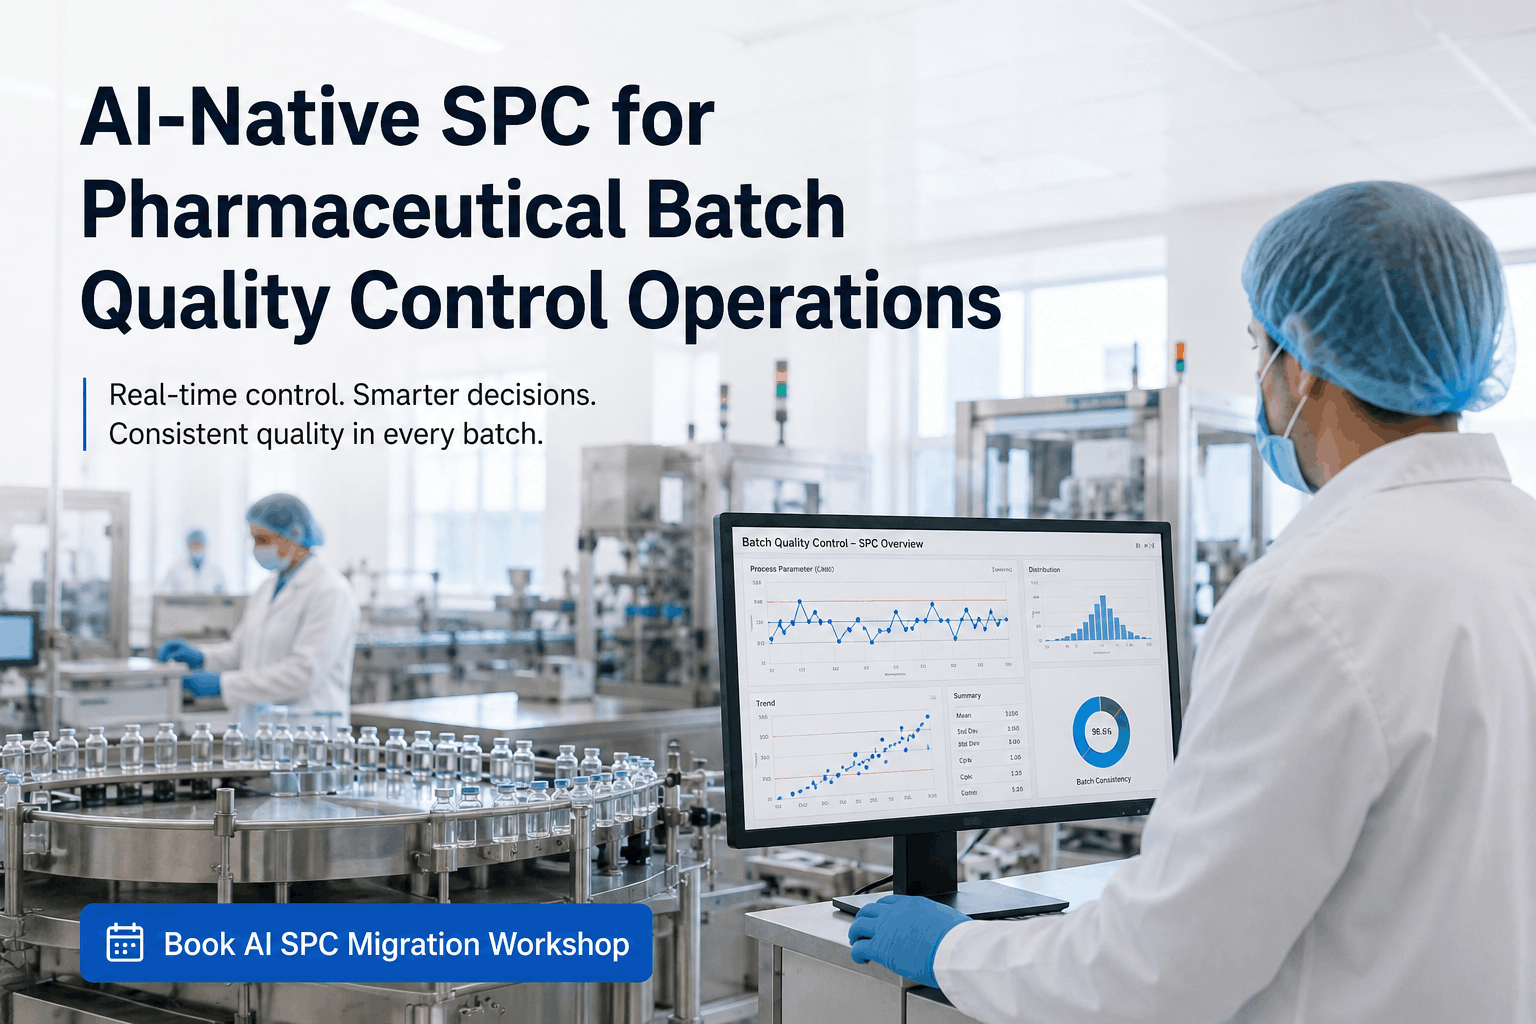
SQC tracks both the process and the model’s health.
Approved rules combine the evidence into release or rejection.
Dissolution is the classic example. Instead of testing tablets in the lab, a model predicts dissolution from material attributes, process parameters and in-line measurements such as tablet weight, hardness and NIR spectra. The model is validated against lab dissolution across the design space before it is used for release.
The strength of the strategy lies in combining sources, so no single sensor failure leaves a batch unassessed. That design principle is central to every RTRT plan.
A Practical Path to RTRT
Most successful RTRT programs follow a staged path. Each stage delivers value even before RTRT is approved.
Identify critical quality attributes and parameters, and gather data across normal variation.
Install in-line or at-line measurement and connect process data with batch context.
Build and calibrate models across the design space, including deliberate variation.
Run models beside traditional tests for many batches and compare results statistically.
Include the RTRT strategy and validation data in the regulatory submission.
Release on RTRT, monitor models continuously and manage changes under control.
Early regulator dialogue pays off at every stage.
The parallel testing stage is where confidence is built, and it often lasts many months. During it, PAT and model outputs already improve process control, so the investment pays back before release changes.
Continuous manufacturing lines, with steady-state operation and rich sensor data, are natural candidates. Batch processes can also qualify with the right PAT. We can assess candidates during a feasibility review.
Keeping RTRT Models Trustworthy
A model that releases batches must be treated with the same care as an analytical method. Its lifecycle does not end at approval.
| Stage | What happens | What to watch |
|---|---|---|
| Calibration | Model built on data covering the expected range of materials and conditions | Gaps in the calibration range |
| Validation | Performance proven against reference methods, including parallel testing | Bias, precision and range |
| Routine monitoring | Predictions and residuals charted batch by batch | Drift, outliers and spectral anomalies |
| Maintenance | Periodic checks and recalibration when materials or equipment change | Supplier changes, instrument service |
| Change control | Model versions managed like any GMP change | Impact on registered approach |
SQC is essential here. Control charts on model residuals and on key spectral statistics show when the model is being asked to predict outside its experience, which is the most common cause of error. An alert at that point triggers investigation before a wrong release decision is made.
Instrument health matters too: a PAT probe that fouls or drifts must be detected, not trusted blindly. Probe diagnostics feed the same monitoring.
Good First Candidates for RTRT
Not every product or test is a good starting point. These are common first candidates.
NIR monitoring of blend homogeneity, often the first PAT application in solid dose.
NIR or Raman on tablets, or weight plus blend data, predicting content uniformity.
Dissolution predicted from materials, process parameters and tablet properties.
Steady-state processes with rich sensors and residence time models.
Raw material identity by NIR at receipt, reducing lab testing.
Terminal sterilization release based on validated cycle parameters, the original form of RTRT.
Starting with one attribute, such as blend uniformity, builds the data, skills and regulatory experience needed for full RTRT later. See a staged plan in a demo.
RTRT Pitfalls to Avoid
These are the issues that most often slow or stall RTRT programs.
Most pitfalls are avoided by treating RTRT as a program with its own governance rather than an instrument purchase. Our team can help structure it.
The Value of RTRT Beyond Faster Release
Shorter release lead time is the headline benefit, but it is rarely the only one. A realistic business case counts several sources of value.
These benefits arrive at different times. Process insight and earlier detection start as soon as PAT and data are in place, long before approval. Inventory and lab savings follow once RTRT is authorised and in routine use.
Building the case in stages keeps the program funded through the long parallel testing period. Our advisors can help frame it for your leadership.
How iFactory Supports the Path to RTRT
Process, PAT, material and lab data linked by batch and time.
Tools to build and compare predictive models on real data.
Model predictions and lab results compared batch by batch.
Residual and spectral SQC with alerts on drift.
PAT instrument diagnostics tracked alongside results.
Model versions, validation data and approvals kept together.
It works with your existing PAT instruments, MES and LIMS. Bring one product and we will outline a staged RTRT path in a session.
Find Out Where RTRT Fits in Your Portfolio
We review your products, processes and data, identify the best first attribute for model-based release and set up the data foundation and parallel testing views to start building evidence.
Model prediction and parallel lab assay agree on 58 of 60 batches. Two differences both near the edge of the calibration range.
A Parallel Testing Review
This exchange shows how a process engineer might review RTRT progress with iFactory.
iFactory ships as a pre-configured NVIDIA AI server, racked and ready with the PAT data, model monitoring and SQC models loaded. Rack it, plug in power and Ethernet, and the AI is live on your network. Our scope covers sensors and data connections across production lines, PAT instruments and labs, PLC/SCADA, MES, LIMS and ERP integration, cabling and network setup, operator and quality team training, and 24×7 remote monitoring.
Server installed, sensors and system links live, historical batch, lab and maintenance records loaded.
Models trained on your own batches and equipment, then run in parallel on one area with your quality and engineering teams reviewing every output.
Rollout to the agreed areas under your change control and validation procedures, team training and 24×7 remote monitoring in place.
Software, server and integration come as one package. For pricing on your lines, contact our sales team.
Frequently Asked Questions
RTRT is the ability to evaluate and ensure product quality based on process data, typically a valid combination of measured material attributes and process controls, instead of relying only on end-product testing.
Yes. It is described in ICH Q8(R2), the EMA guideline on real time release testing has applied since October 2012 and the FDA supports it through its PAT framework. It must be approved for each product before use.
Typically PAT instruments such as NIR and Raman spectroscopy, process parameter data, validated predictive models and statistical monitoring, combined in an approved control strategy.
Under the EMA guideline, a failed RTRT result cannot simply be replaced by the traditional end-product test. Failure handling must be defined in advance and investigated.
It varies by product. Building process understanding, PAT, models and parallel testing data often takes many months before submission, though PAT delivers process control benefits along the way.
Start with one attribute, such as blend uniformity, on a product with good process understanding and data. We can help assess candidates with our specialists.
Release Batches on Evidence Gathered While They Are Made
iFactory links PAT, process and lab data, manages predictive models through their lifecycle and watches everything with SQC, giving you a practical path to real-time release.
Illustrative comparison. RTRT removes waiting for end-product tests once the approach is approved.



.png)