
A feedwater line that loses 3mm of wall thickness a year fails silently until the day it doesn't. Power plant piping, drums, and pressure vessels corrode from the inside where nobody can see it, and by the time a leak shows up on the outside, the metal loss has usually been building for months or years. Corrosion coupons, electrical resistance probes, and linear polarization resistance electrodes exist to catch that loss while it is still a number on a dashboard instead of a forced outage. This guide walks through how each method works, where to place them across a typical plant, and how iFactory turns raw corrosion readings into action-ready thresholds your team can actually manage.
Why Corrosion Monitoring Cannot Be an Annual Exercise
Wall thickness surveys with a handheld ultrasonic gauge tell you where you stand today. They say nothing about the rate at which you got there or where you'll be in six months. A single UT reading taken once a year cannot distinguish between a pipe that has always corroded slowly and one that just entered an aggressive phase because chemistry, flow velocity, or temperature shifted. Continuous or high-frequency corrosion monitoring closes that gap by turning corrosion from a static inspection finding into a trend line your operations team can watch.
Corrosion Rate Changes Faster Than Inspection Cycles
A boiler feedwater system running clean for years can shift into an aggressive corrosion regime within weeks after a chemistry excursion, an oxygen ingress event, or a change in makeup water source. Annual UT surveys miss that window entirely.
Flow-Accelerated Corrosion Targets Specific Geometry
FAC concentrates at elbows, tees, reducers, and downstream of orifices where turbulence strips the protective magnetite layer faster than it can reform. These locations corrode many times faster than straight pipe runs a few feet away.
Late Detection Means Emergency Repair, Not Planned Work
A pinhole leak discovered during operation forces an unplanned outage, hot work permits under pressure, and scaffold and insulation removal on a compressed schedule. A trending corrosion rate lets the same repair happen during a scheduled window.
Turn Corrosion Readings Into a Managed Program
iFactory ingests coupon, ER probe, and LPR data into one trending dashboard with automatic threshold alerts, so corrosion management stops living in a spreadsheet nobody opens between outages.
Three Monitoring Technologies, Three Different Jobs
No single method covers every corrosion mechanism in a power plant. Coupons, ER probes, and LPR electrodes measure different things at different speeds, and most plants need all three deployed at the right locations to get a complete picture.
Corrosion Coupons — Weight-Loss Measurement
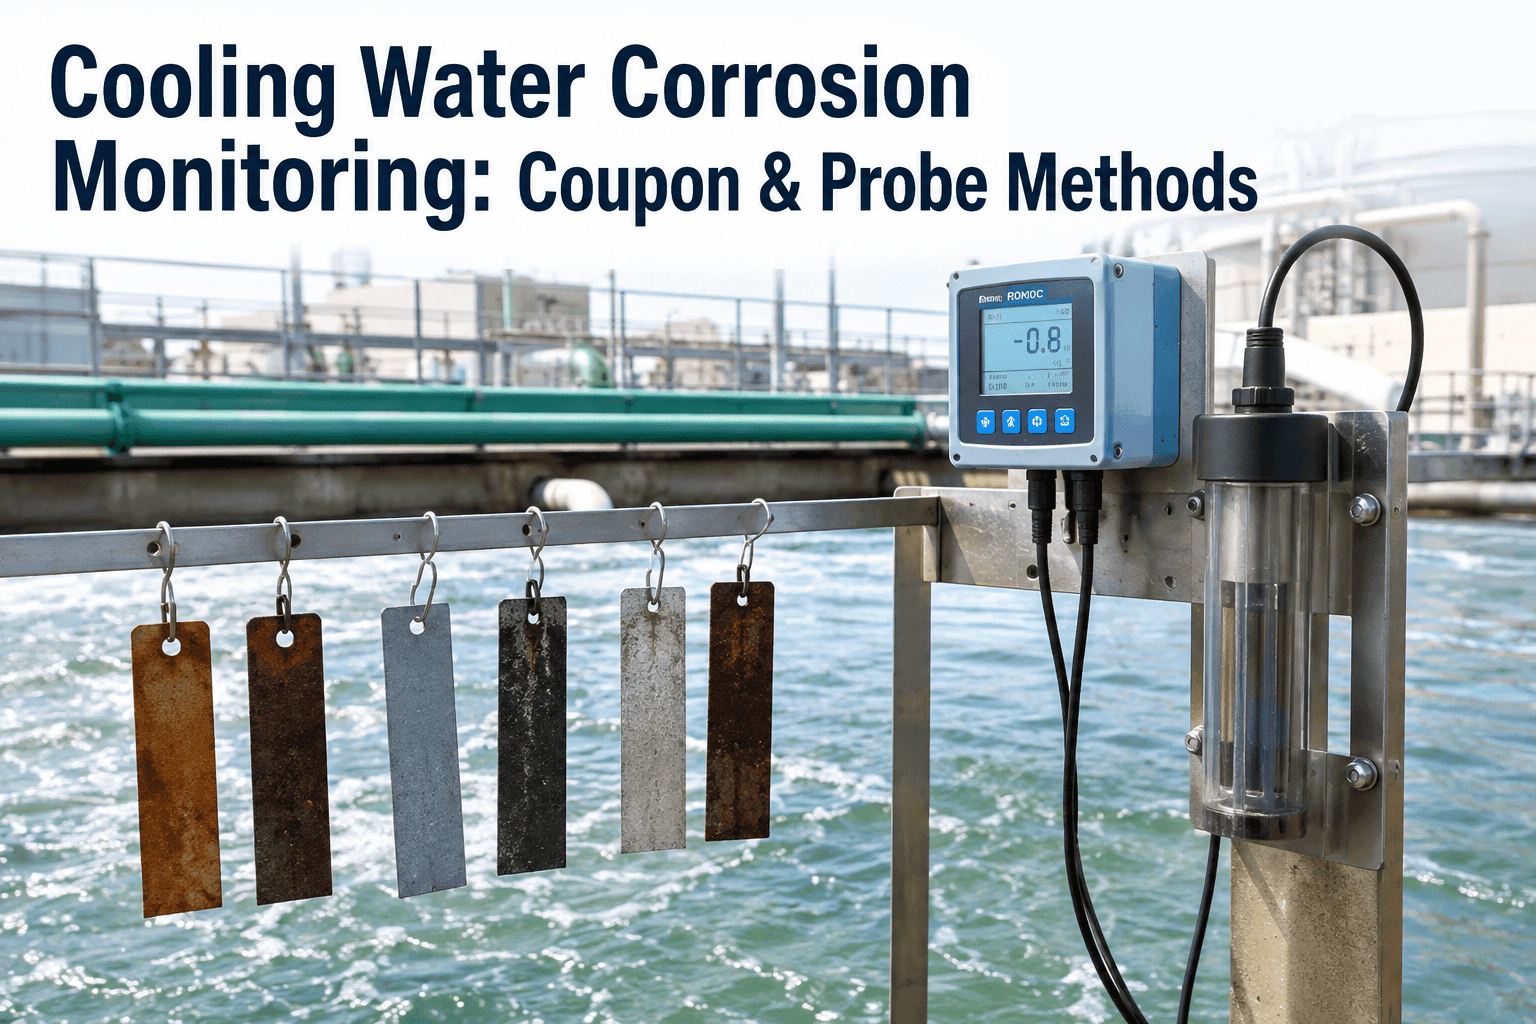
A pre-weighed metal specimen, matched to the pipe or vessel alloy, is inserted into the process stream through an access fitting and left exposed for a set interval, typically 30 to 90 days. On removal, the coupon is cleaned, re-weighed, and the metal loss is converted to mils per year using exposure time, surface area, and material density. Coupons remain the reference method against which electronic probes are calibrated because the measurement is a direct physical loss, not an inferred electrical signal.
The tradeoff is speed. A coupon program can only ever tell you the average rate over the exposure window — it cannot show a spike that occurred on day 12 and resolved by day 40. For systems where chemistry is stable and slow trending is the concern, that averaging is a strength, not a weakness, because it smooths out short-term noise.
Electrical Resistance (ER) Probes — Continuous Metal Loss
An ER probe uses a thin metal element exposed to the process fluid. As corrosion reduces the element's cross-section, its electrical resistance rises in a predictable relationship. The probe reports metal loss continuously, working equally well in liquid, vapor, or gas service — including systems where LPR cannot function because there is no continuous electrolyte, such as steam lines or hydrocarbon streams.
Because ER probes accumulate metal loss over their service life, the reported number is a running total rather than an instantaneous rate. Trending software has to calculate the rate of change between readings, which is exactly where a platform like iFactory earns its keep — pulling raw resistance values and converting them into a live mpy trend without manual spreadsheet math.
Linear Polarization Resistance (LPR) — Instantaneous Rate
LPR electrodes apply a small voltage across two or three electrodes immersed in a conductive fluid and measure the resulting current. The polarization resistance is inversely proportional to the instantaneous corrosion rate, giving a reading within minutes rather than weeks. This makes LPR the fastest-responding method available and the natural choice for catching short-lived corrosion events tied to a chemistry upset or process change.
LPR only works in fluids conductive enough to support the electrochemical measurement, which rules out steam and most hydrocarbon service. It also assumes uniform corrosion; it will not reliably flag localized pitting or under-deposit corrosion, which is why LPR is typically paired with coupons for cross-validation rather than deployed alone.
Where Corrosion Monitors Actually Belong
Placing every probe at the easiest access point wastes the program. Monitoring location should follow the plant's known corrosion risk map, not pipe rack convenience.
Map Your Plant's Highest-Risk Corrosion Points
iFactory's team reviews your piping isometrics and process chemistry to recommend monitoring locations before a single probe goes in the ground, so budget goes where the risk actually lives.
Reading the Data: Rate Categories and Action Thresholds
A raw mpy number means nothing without a threshold framework attached to it. Most plants classify corrosion rate into four bands, each carrying a different response requirement.
| Corrosion Rate | Classification | Typical Response | Re-Inspection Interval |
|---|---|---|---|
| Below 1 mpy | Low | Continue routine monitoring cadence | Annual coupon pull |
| 1 to 5 mpy | Moderate | Increase monitoring frequency, review chemistry trend | Quarterly |
| 5 to 10 mpy | High | Root cause investigation, consider inhibitor dosing change | Monthly |
| Above 10 mpy | Severe | Immediate engineering review, remaining-life calculation | Continuous / weekly |
The threshold table only works if the underlying data is trended consistently, which is where manual coupon logs and disconnected ER probe readouts break down. When corrosion data lives in three different formats across three different technicians' notebooks, a rate that crossed into the severe band three weeks ago can go unnoticed until the next scheduled review. iFactory pulls readings from coupons, ER probes, and LPR electrodes into a single trend view per monitoring location, flags any point that crosses a configured threshold, and routes the alert to the responsible engineer automatically rather than waiting for the next manual roundup.
Matching Coupon Material to the Line You're Protecting
The single most important variable in a coupon program that most plants get wrong is material match. A corrosion coupon needs to represent the actual alloy of the piping or vessel it stands in for, because corrosion behavior varies significantly between carbon steel, low-alloy steel, and stainless grades even under identical process conditions. A carbon steel coupon inserted into a stainless steel line will produce a rate that has almost no relationship to what the real pipe is experiencing, and a program built on mismatched coupons can quietly generate years of misleading data before anyone questions it, sending false confidence up the reporting chain long after the underlying line has moved into a genuinely aggressive corrosion regime.
Coupon suppliers stock standard alloy matches for the materials most common in power plant service, including A106 carbon steel for feedwater and condensate piping, T22 and T91 low-alloy steel for high-temperature steam lines, and 304 or 316 stainless for cooling water and chemical injection systems. Surface finish matters almost as much as alloy — a coupon should be prepared to match the internal surface condition of the line it represents, since a mirror-polished new coupon will corrode at a different initial rate than the mill-scale finish typical of in-service piping. Programs that standardize alloy and finish selection against a documented piping material list avoid the single most common source of coupon data that engineers later have to discard.
Flow-Accelerated Corrosion Deserves Its Own Watch List
Flow-accelerated corrosion (FAC) is responsible for some of the most consequential piping failures in the power industry, including catastrophic ruptures at operating plants that led to fatalities and permanently changed how utilities approach single-phase and two-phase piping inspection. FAC occurs in carbon steel piping carrying deaerated water or wet steam at elevated temperature, where the protective magnetite oxide layer dissolves into the flow faster than it can regenerate. Unlike general corrosion, FAC does not announce itself with uniform thinning — it carves localized wall loss at specific geometric features while leaving adjacent straight pipe nearly untouched.
Managing FAC risk means combining three data streams: a susceptibility model based on piping material, geometry, and operating conditions; periodic UT thickness surveys at predicted high-risk points; and continuous corrosion rate monitoring at representative locations to validate that the susceptibility model still matches reality. Plants that skip the modeling step and rely on UT surveys alone often inspect the wrong locations, because FAC susceptibility shifts whenever chemistry, load profile, or piping modifications change.
Build a Defensible FAC Monitoring Program
iFactory combines your piping susceptibility data with live corrosion probe trends so FAC-prone locations get inspected on a risk basis instead of a fixed calendar interval.
Calibrating Electronic Probes Against Coupon Data
Electronic probes are convenient, but they are not infallible, and the surest way to lose confidence in a monitoring program is to let ER or LPR readings drift away from physical reality without anyone noticing. Probe elements can foul with scale or biological growth, developing an insulating layer that skews resistance readings low and masks real metal loss underneath. Reference electrodes in LPR systems can polarize incorrectly if solution conductivity changes seasonally, particularly in cooling water systems where chloride content shifts with makeup water source. Neither failure mode announces itself — the probe keeps reporting numbers, they just stop matching what is actually happening to the pipe wall.
Running a coupon in parallel with an electronic probe at the same monitoring location, even if only for a periodic validation cycle rather than continuously, gives a physical anchor point against which drift can be caught. Best practice calls for a parallel coupon exposure at least twice a year for any electronic probe location considered critical, with results compared directly against the electronic rate over the same window. When the two diverge by more than roughly 20 percent, that is the signal to pull and inspect the probe element rather than trust either number blindly. Plants running iFactory can flag this comparison automatically, since both data streams land in the same trend view and a configurable variance alert catches drift before it costs months of bad data.
Building the Business Case for a Monitoring Upgrade
Corrosion monitoring programs rarely fail because the technology doesn't work. They fail because the business case for expanding beyond a handful of legacy coupon racks never gets made in terms a plant manager or reliability director can act on. Three numbers tend to move that conversation forward: the cost of a single unplanned outage caused by a piping leak, the cost of the inspection and repair labor that a planned shutdown avoids compared to an emergency response, and the insurance or regulatory exposure created by an undocumented corrosion history at the time of an incident investigation.
A mid-size combined-cycle unit forced offline by a feedwater line failure can lose well over $500,000 in a single event once replacement power costs, repair labor, and NERC or dispatch penalties are included. Against that number, a monitoring upgrade covering twenty to thirty additional locations — probes, access fittings, and a trending platform — typically costs a small fraction of one avoided outage. The math gets easier still when a plant already has FAC-related incidents in its history, because insurers and regulators increasingly expect documented, continuous corrosion monitoring as a baseline control rather than an optional enhancement, and gaps in that documentation can complicate claims and audit findings well after the immediate repair is complete.
The second half of the business case is less about hardware and more about process. Plants that already own coupons and probes but still struggle with corrosion management usually have a data problem, not a sensor problem. Readings get logged in a spreadsheet that only one technician updates, threshold breaches get caught during a quarterly review instead of the week they happen, and the connection between corrosion trend data and the inspection schedule lives entirely in someone's memory. Fixing that gap costs far less than adding sensors, and it is usually the highest-leverage first step for a plant serious about reducing pressure vessel and piping failure risk.
Frequently Asked Questions
Stop Managing Corrosion Data in Spreadsheets
iFactory unifies corrosion coupons, ER probes, and LPR electrodes into one trending platform with automatic threshold alerts and RBI integration — built for power plant piping and pressure vessel programs.



.png)