A single 47-second power interruption at a hyperscale facility once corrupted three weeks of distributed training and cost tens of millions of dollars — not because the backup power failed to arrive, but because nobody caught the degrading component that caused the interruption until it had already happened. For an operations director running Tier III or Tier IV infrastructure, the real reliability question isn't whether redundant generators and UPS strings exist; it's whether anything is watching the health of every component in that redundancy chain closely enough to catch the failure before it reaches the load.
99.999% Uptime Isn't a Design Spec. It's What You Monitor Every Second Between Audits.
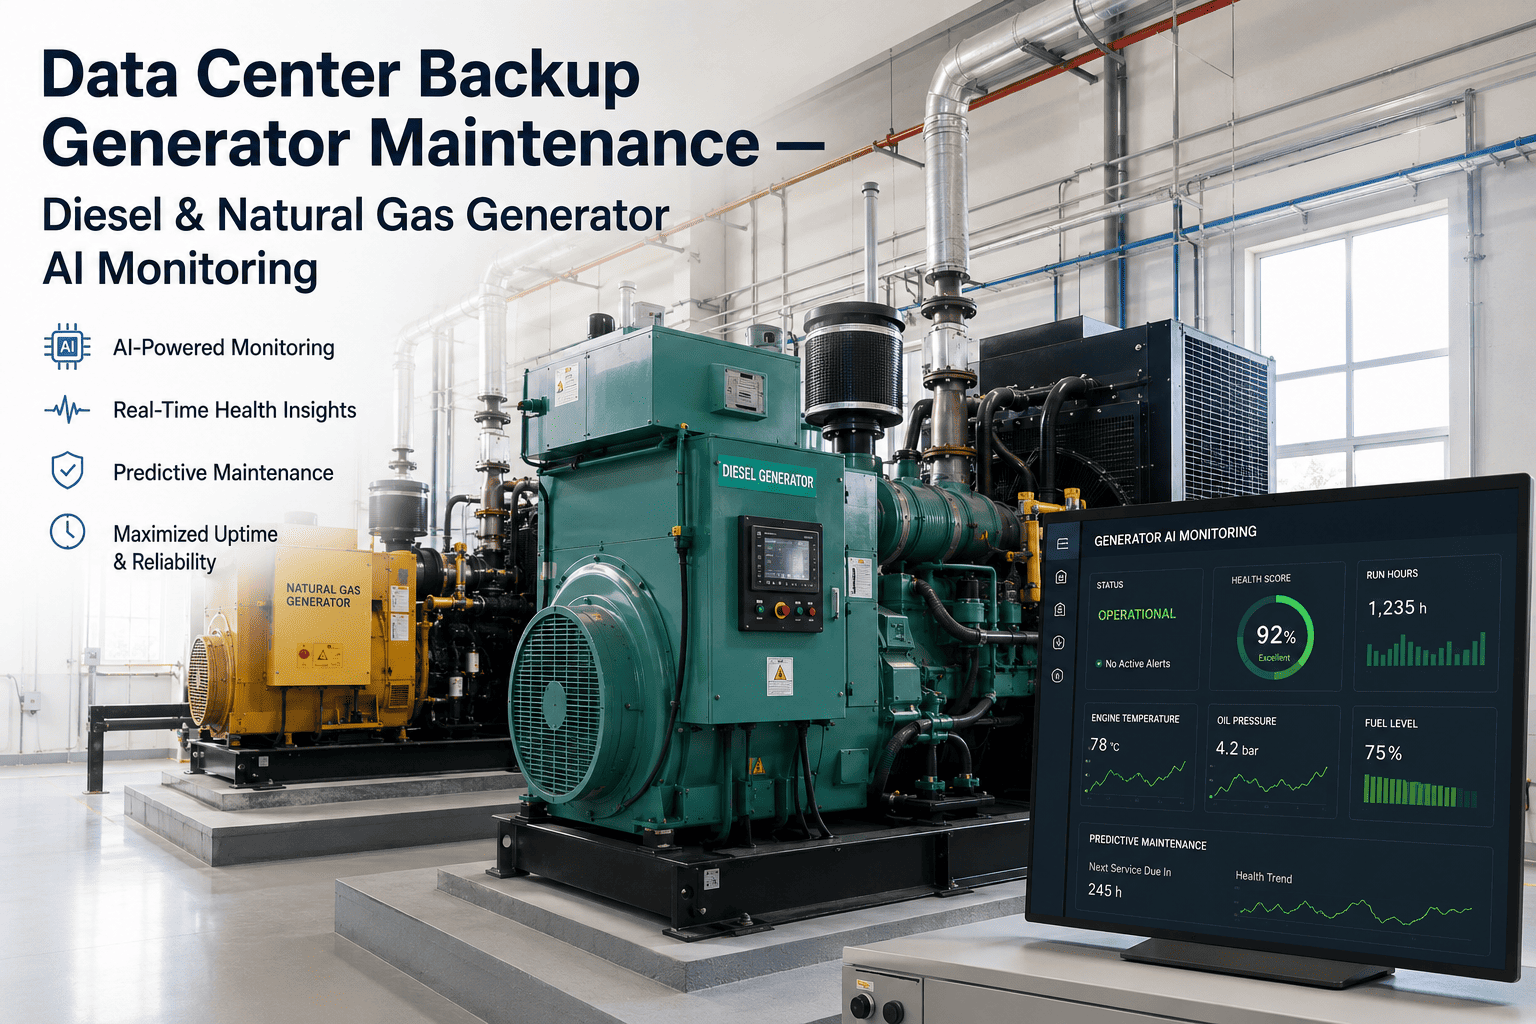
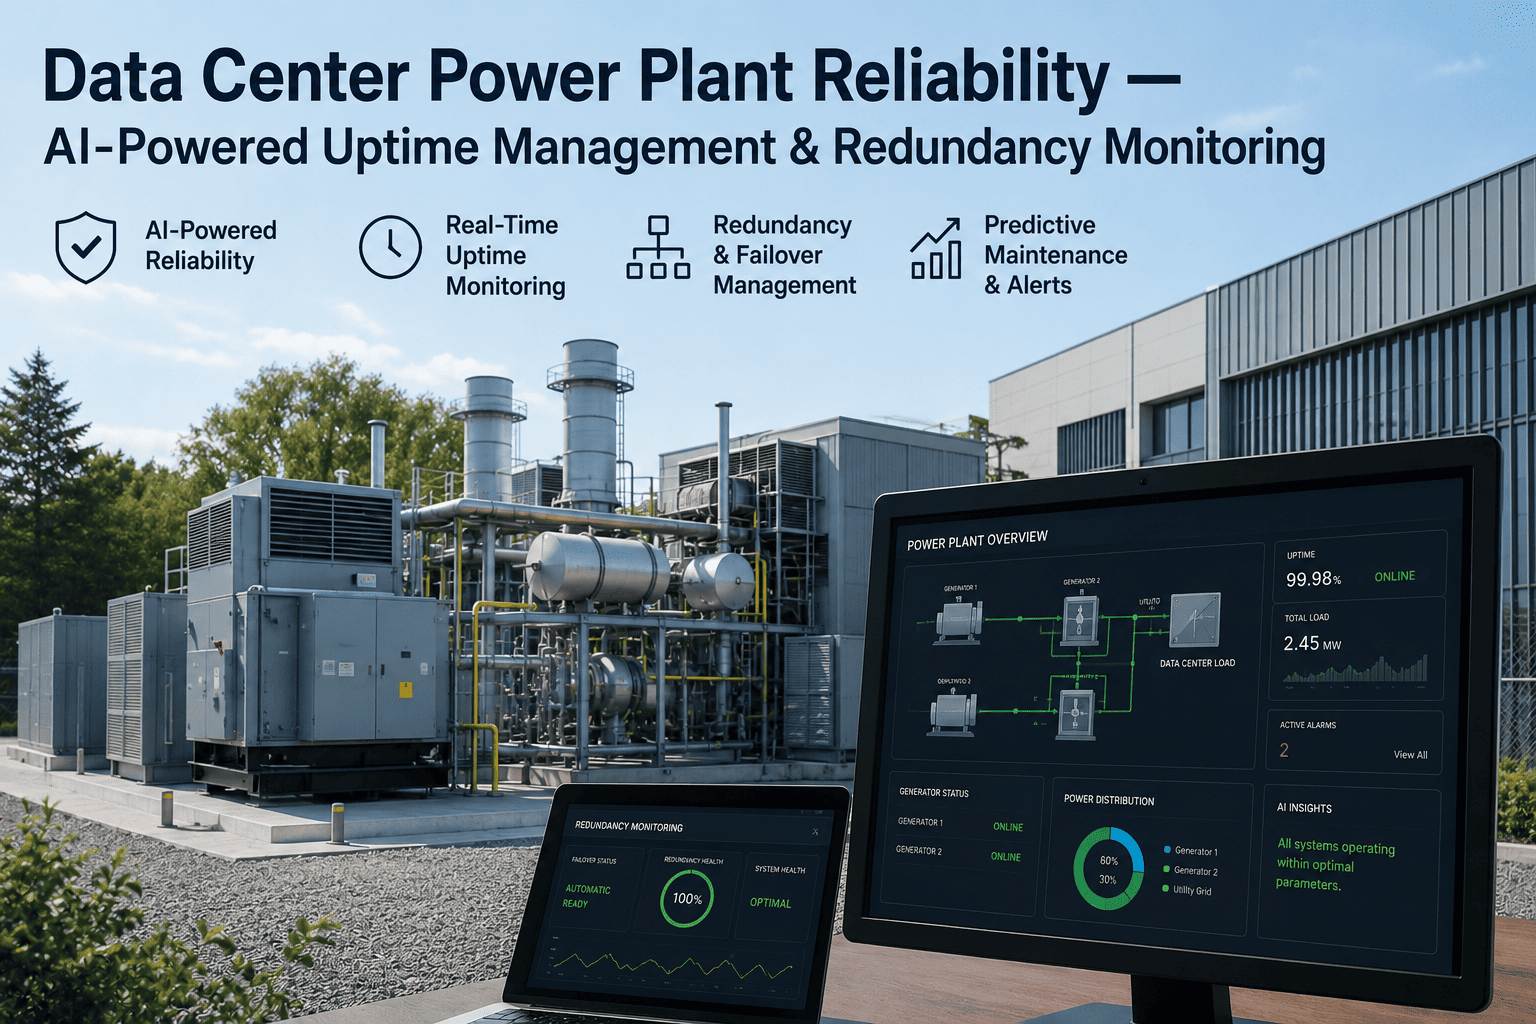
AI-powered condition monitoring across generators, UPS systems, and electrical distribution catches the component degradation that redundancy alone can't — turning a Tier III or Tier IV design into an operating reliability record.
Redundancy Design Tells You What Should Happen. Monitoring Tells You What's Actually Happening.
N+1 and 2N architectures exist to guarantee that no single component's failure can bring down the load. That's a sound engineering principle, and it's also not the same thing as reliability in practice. A Single Point of Failure isn't always an obvious design gap — it's frequently a redundant component that was supposed to be available but wasn't, because a UPS battery string had degraded past its rated capacity, a generator's fuel injector was drifting out of tolerance, or a transformer connection had been slowly overheating for months without tripping any threshold alarm.
Global data center electricity demand has surged past 1,000 TWh, driven overwhelmingly by high-density AI and GPU clusters pulling 30 to 40 kW per rack. That density shift raises the stakes on every component in the power chain, because the financial impact of an outage on a cluster performing distributed training isn't measured only in downtime minutes — it's measured in corrupted training runs and hardware damage from uncontrolled shutdowns. AI-powered condition monitoring is what closes the gap between a redundancy diagram that looks correct on paper and a power chain where every component is verified continuously to actually be ready.
What AI Monitoring Watches Across the Power Chain
N+1 vs. 2N — and Why the Redundancy Level Isn't the Whole Answer
Neither architecture is worth its design intent if the components inside it aren't independently verified to be healthy. A 2N facility with one path silently degraded is, functionally, running N+1 without knowing it — and the entire value of the second path evaporates exactly when it's needed most. Condition monitoring is what confirms both paths are genuinely available, not just present on the single-line diagram.
See how AI condition monitoring maps against your specific redundancy architecture — N+1, 2N, or a mixed configuration across generators and UPS strings.
The Cost of a Missed Signal, by Tier
| Tier Level | Redundancy Standard | Typical Availability Target | Where AI Monitoring Adds the Most |
|---|---|---|---|
| Tier I | Single path, no redundancy | 99.671% | Early warning is the only mitigation available — no backup path exists |
| Tier II | Single path with redundant components | 99.741% | Confirming the redundant component is actually ready, not just present |
| Tier III | Multiple paths, one active | 99.982% | Verifying failover path health continuously, not only during testing |
| Tier IV | 2N, fully fault-tolerant | 99.995%+ | Catching the rare simultaneous-degradation scenario across both paths |
From Battery Trend to Work Order — How a Degradation Signal Becomes Action
Why This Matters More at AI-Density Racks Than It Did a Few Years Ago
The reliability math that governed data center power for the last two decades assumed a rack pulling 5 to 10 kW. AI and GPU clusters routinely exceed 30 kW per rack today, and training workloads are uniquely sensitive to even brief interruptions because a power event mid-run doesn't just cause downtime — it can corrupt a training job that was hours or days into completion, discarding compute cost that dwarfs the cost of the outage itself. That sensitivity is why modern AI infrastructure targets uptime figures that allow only tens of seconds of interruption per year, a bar that redundancy design alone cannot guarantee without continuous verification that every redundant component is actually fit to serve.
The monitoring layer that catches component drift doesn't replace the electrical engineering behind N+1 or 2N design — it's what makes that design's assumptions actually hold true in daily operation, months and years after commissioning, rather than only on the day of the acceptance test.
Building the Business Case Leadership Actually Signs Off On
An operations director pitching continuous condition monitoring to a finance or executive audience rarely wins the argument with uptime percentages alone — 99.995% and 99.999% sound similar enough that the difference gets lost in the room. What lands is the cost-avoidance framing: the number of hours of generator runtime a facility burns every year on redundant capacity it hopes never to use, set against the cost of a single unplanned outage on a rack running a multi-week training job. A 47-second interruption that corrupts a distributed training run doesn't cost 47 seconds of downtime — it costs every hour of compute sunk into the job up to that point, which for large clusters can run into tens of millions of dollars. Framing monitoring investment against that asymmetry, rather than against a generic uptime SLA number, is what tends to move a budget conversation forward.
The other piece of the business case that's easy to overlook is insurance and colocation contract leverage. Facilities that can produce continuous condition data — battery health trends, generator load-test history, thermal imaging logs — are in a materially stronger position both when negotiating insurance premiums tied to outage risk and when a colocation customer's due diligence team asks for evidence that redundancy claims hold up in daily operation, not just on a commissioning day acceptance test. That data becomes a contractual and financial asset in its own right, independent of the reliability benefit itself.
Frequently Asked Questions
Does AI monitoring replace scheduled generator load testing and UPS battery testing?
No, it complements scheduled testing rather than replacing it. Load tests and battery capacity tests remain the definitive validation of full-system performance under real conditions, and most compliance frameworks still require them on a fixed cadence. What continuous AI monitoring adds is visibility in the months between those scheduled tests, when a battery string or generator component can degrade well past the point where it would pass a test performed today but fail one performed in three months. Catching that drift early turns a scheduled test failure into a planned component replacement instead of a discovery made under pressure.
How does this integrate with our existing BMS and DCIM software?
The monitoring platform connects to existing building management systems and DCIM software as an additional analytics layer, pulling in the power quality, thermal, and vibration data those systems already collect rather than requiring a separate parallel monitoring infrastructure. Where gaps exist — commonly thermal imaging on distribution panels or vibration sensing on generator sets — additional sensors are added incrementally. The goal is a single reliability view rather than a second dashboard competing with the one your facilities team already uses daily. iFactory Support can confirm specific BMS and DCIM compatibility for your facility.
Can this help us verify a colocation provider's redundancy claims before signing a contract?
Condition monitoring data, once deployed, gives an operations team an evidence-based way to audit whether a provider's stated redundancy — feed diversity, critical transformer placement, UPS configuration — is holding up in daily operation rather than only on the single-line diagram presented during the sales process. For a facility already under contract, historical monitoring data becomes the basis for structured conversations about SLA performance rather than relying solely on provider-reported uptime figures. For a facility still being evaluated, requesting visibility into existing monitoring data as part of due diligence is a reasonable ask of any provider claiming Tier III or Tier IV performance.
What's realistic for time-to-value — how soon do we see actionable findings?
Most facilities see baseline anomaly detection within the first several weeks of connecting existing sensor and BMS data, since the models start by learning your specific equipment's normal operating envelope rather than applying generic thresholds. Findings that require months of trend data — like slow battery capacity fade or gradual bearing wear on a generator — naturally take longer to surface with statistical confidence, but the platform flags obvious anomalies from week one. A 30-minute walkthrough can map a realistic timeline against your specific equipment inventory and existing instrumentation.
Does this scale across a multi-site data center portfolio, or is it a single-facility tool?
Condition monitoring is designed to aggregate across a portfolio rather than operate as an isolated tool per facility. Battery degradation patterns, generator drift signatures, and thermal anomaly baselines learned at one site can inform what the model watches for at another, particularly useful for portfolios running the same UPS or generator models across multiple locations. For an operations director overseeing several facilities, this typically means a single consolidated reliability view across sites rather than separate dashboards per location, with portfolio-level reporting that rolls up to whatever cadence an executive team needs for board or investor reporting. A 30-minute session can map this against your specific site count and equipment standardization.
A redundancy diagram is only as reliable as the last time every component in it was actually verified healthy. See what continuous condition monitoring would surface across your generators, UPS strings, and distribution today.