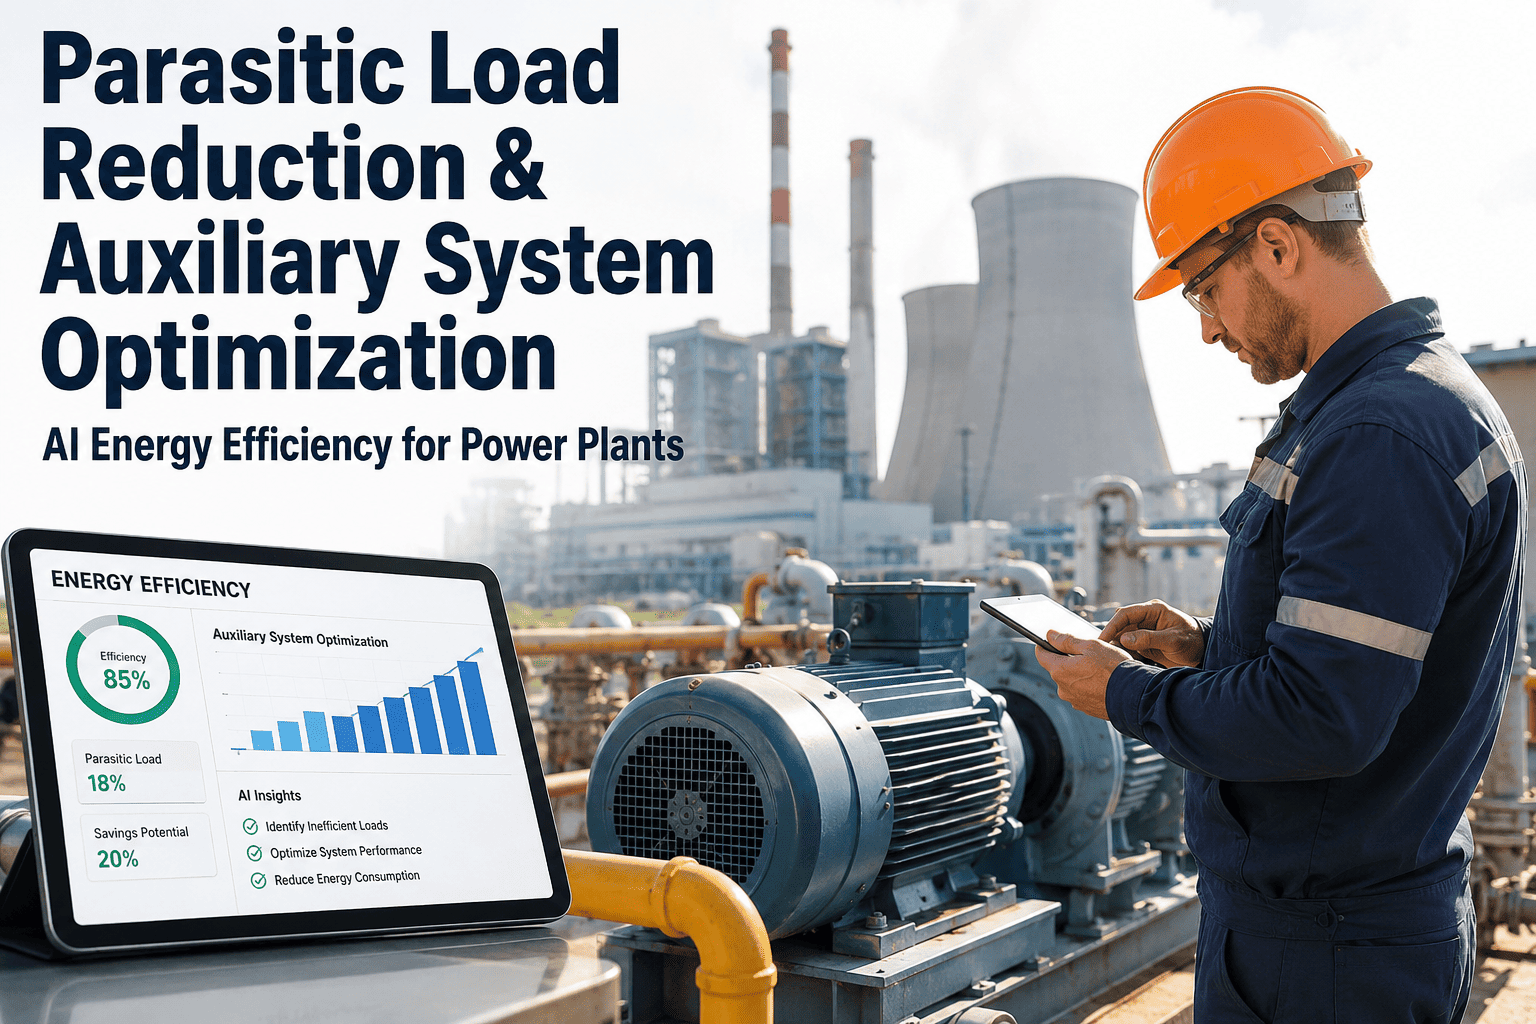
Every megawatt a power plant burns internally to run its own pumps, fans, compressors, and HVAC systems is a megawatt that never reaches the meter or the market — and in most plants, auxiliary power consumption is set once during commissioning and rarely re-optimized against how the unit actually operates years later. Station service loads that were sized for worst-case conditions keep running at worst-case speed year-round, even when ambient conditions, load, and equipment condition would allow significant reduction without touching output or reliability. AI-driven auxiliary load optimization changes that by continuously matching pump, fan, compressor, and HVAC output to real-time demand instead of static setpoints. Book a Demo to see how much recoverable generation capacity is sitting in your plant's own house load today.
Cut Station Service Load 10-20% Without Touching Output
iFactory's AI continuously optimizes pump, fan, compressor, and HVAC load against real operating conditions — recovering auxiliary power as net generation capacity, automatically.
Why Auxiliary Power Consumption Runs Higher Than It Needs To
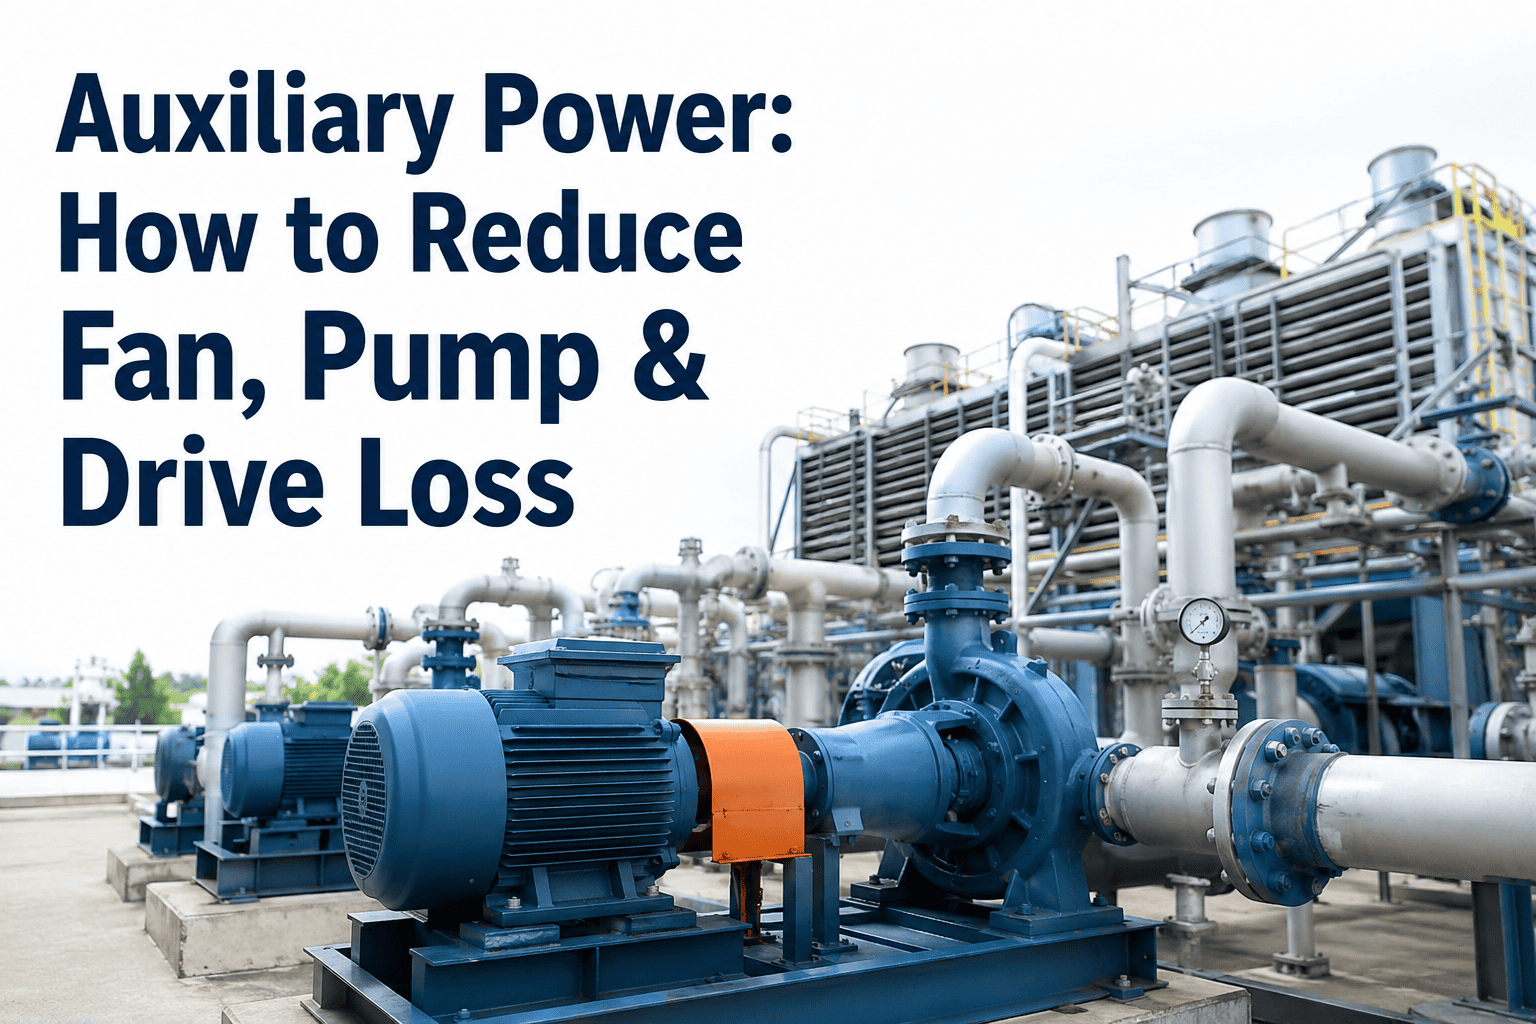
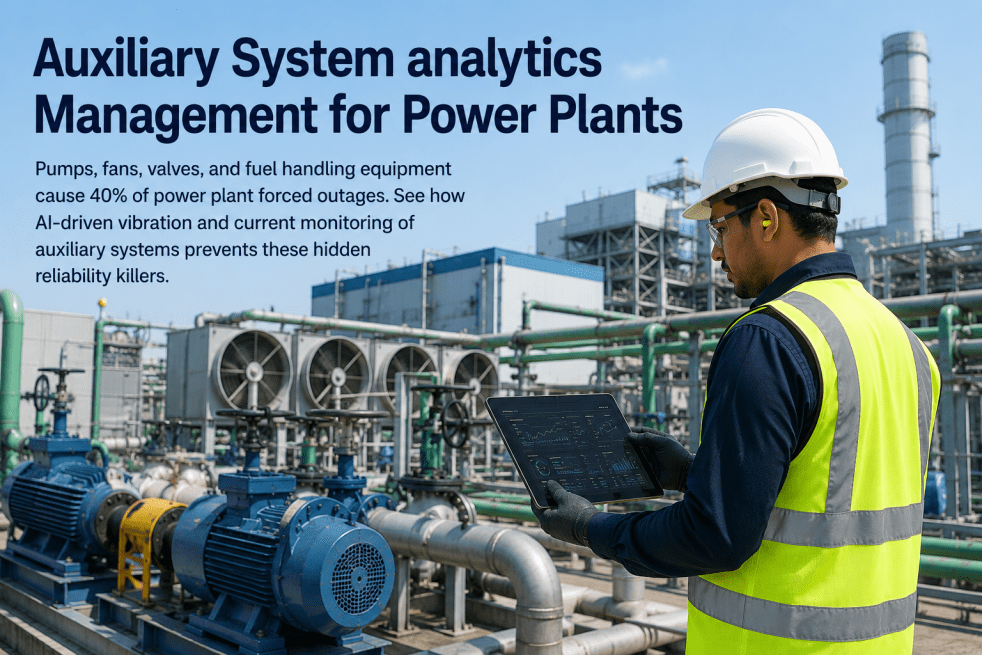
Auxiliary power — sometimes called station service or house load — typically consumes 5-10% of a power plant's gross generation before a single megawatt reaches the grid. Cooling water pumps, forced and induced draft fans, air compressors, condensate pumps, and HVAC systems are usually controlled by fixed setpoints or simple PID loops tuned once at commissioning and left largely untouched for the life of the unit.
The problem is that real operating conditions almost never match commissioning assumptions. A cooling water pump sized and controlled for peak summer ambient runs at the same speed on a mild spring day when far less flow is actually needed. A compressed air system holds header pressure well above what any connected load requires because no one has re-tuned it since startup. Plants that apply AI-driven load optimization to these systems typically recover 10-20% of auxiliary power consumption — capacity that converts directly into additional net generation available for dispatch.
On a 500 MW plant with an 8% auxiliary load ratio, recovering just 15% of house load through optimization frees up roughly 6 MW of net generation capacity — worth well over $2 million annually at typical wholesale power prices.
Where Auxiliary Power Actually Goes: Load Breakdown
Not every auxiliary system contributes equally to house load, and the optimization opportunity varies significantly by system type. The breakdown below reflects a representative fossil or combined-cycle plant's auxiliary load distribution — the starting point for prioritizing which systems to optimize first.
Six Components of AI-Driven Auxiliary Load Optimization
Pump Curve Matching
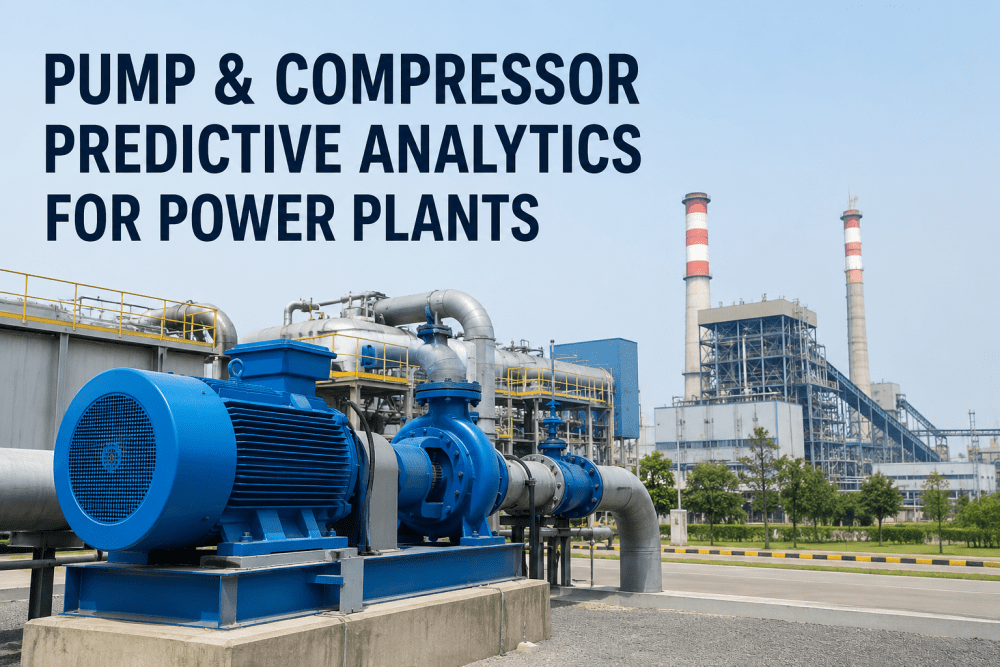
Variable speed drives are continuously commanded against the actual system curve rather than a fixed setpoint, eliminating throttling losses on cooling water, condensate, and feedwater pumps.
VSD OptimizationFan Static Pressure Optimization
Forced and induced draft fan speed is trimmed to the minimum static pressure required for combustion and emissions compliance, removing margin that was built in for conditions that rarely occur.
Draft ControlCompressor Sequencing & Header Pressure Trim
Multiple air compressors are sequenced by AI to match connected load exactly, and header pressure is trimmed to the true minimum required by downstream instrumentation and pneumatics.
Air System AIHVAC Load Scheduling
Control room, switchgear, and building HVAC systems are scheduled against occupancy and equipment heat load rather than running continuously at fixed setpoints regardless of actual demand.
Building SystemsReal-Time Load Shedding Logic
During peak-price or capacity-constrained periods, non-critical auxiliary loads are automatically deferred or reduced within safe operating bounds to maximize net generation exactly when it is most valuable.
Dispatch-AwareAuxiliary Power Trend Reporting
Every optimized system reports its baseline versus optimized consumption continuously, giving plant managers a defensible, ongoing record of recovered capacity for performance and financial reporting.
ReportingAuxiliary System Optimization: Before and After
The table below illustrates typical baseline versus optimized load figures across the major auxiliary system categories on a representative 500 MW combined-cycle unit after AI-driven load optimization is deployed.
| Auxiliary System | Baseline Load | Optimized Load | Reduction | Annual Savings |
|---|---|---|---|---|
| Cooling Water Pumps | 4,200 kW | 3,400 kW | 19% | $610,000 |
| FD/ID Fans | 3,100 kW | 2,650 kW | 15% | $380,000 |
| Instrument Air Compressors | 1,800 kW | 1,450 kW | 19% | $290,000 |
| HVAC & Building Systems | 1,200 kW | 980 kW | 18% | $180,000 |
| Condensate & Feedwater Pumps | 2,600 kW | 2,210 kW | 15% | $320,000 |
How the AI Optimization Loop Actually Works
Continuous Demand Modeling
The system builds a live model of actual required flow, pressure, and temperature for every auxiliary system based on unit load, ambient conditions, and equipment condition.
- Real-time system curve estimation
- Ambient and load correlation
- Equipment condition factored in
Constraint-Bound Setpoint Adjustment
Setpoints for VSDs, dampers, and compressor staging are adjusted within safety and reliability constraints defined by engineering — never overriding protective limits.
- Hard limits enforced at all times
- Gradual, bumpless setpoint changes
- Operator override always available
Savings Verification & Reporting
Every optimization action is logged against a pre-optimization baseline, producing a continuously updated, auditable savings figure for financial and operational reporting.
- Baseline vs. optimized comparison
- System-by-system savings attribution
- Exportable for management reporting
Find the Recoverable Capacity in Your Own House Load
Bring your auxiliary power metering data and iFactory will estimate the recoverable megawatts across your pumps, fans, compressors, and HVAC systems.
Deployment Path: From Baseline to Optimized Load
Auxiliary load optimization is deployed in phases rather than as a single disruptive change, so plant operations teams can validate savings at each stage before expanding scope.
Baseline Metering & Data Collection
Auxiliary system power draw is metered and correlated against unit load and ambient conditions for 2-4 weeks to establish a statistically valid baseline.
Pilot System Optimization
One or two high-opportunity systems — typically cooling water pumps or instrument air — are optimized first to validate savings and build operator confidence.
Fleet-Wide Expansion
Once validated, optimization is extended across remaining auxiliary systems and, where applicable, replicated across sister units in the fleet.
Continuous Tuning & Reporting
The system continuously re-tunes as equipment condition and operating patterns shift, with ongoing savings reporting delivered to plant management.
Auxiliary Power Optimization and Emissions Compliance
Fan and draft control optimization in particular sits close enough to combustion and emissions performance that plant engineering teams are often understandably cautious about adjusting it through an automated system. A properly designed optimization platform treats emissions compliance limits as hard constraints that sit above the optimization layer entirely, meaning fan speed and damper position are only trimmed within the envelope that keeps NOx, CO, and opacity readings comfortably inside permitted limits. Any optimization action that would push a reading toward its compliance boundary is automatically withheld, and the system defaults back to the original setpoint rather than testing the edge of a permit condition.
This constraint-first design extends to every auxiliary system the platform touches. Cooling water pump optimization respects minimum flow requirements tied to condenser tube velocity and biofouling control, compressed air header pressure trimming respects the minimum pressure required by safety-critical pneumatic actuators, and HVAC scheduling respects minimum ventilation requirements in classified areas. Plant engineering teams define these boundaries once during commissioning of the optimization system, and the AI operates strictly within them going forward — recovering power only from the genuine margin that exists between actual operating requirements and legacy fixed setpoints, never from the safety or compliance margin itself.
Why Plant Managers Underestimate the Auxiliary Power Opportunity
Auxiliary power consumption rarely gets the same scrutiny as heat rate or capacity factor because it is treated as a fixed cost of running the plant rather than a variable that can be actively managed. Budget reviews typically track total station service consumption as a single line item trended against generation, which masks the system-by-system variation that actually drives the number. A pump running 8% above its true requirement and a fan running exactly at demand can average out to a house load figure that looks unremarkable, even though one of those two systems has significant recoverable capacity sitting inside it.
This is precisely why a system-level audit, rather than a plant-level trend review, is the right starting point for any auxiliary power reduction initiative. Breaking total house load into its pump, fan, compressor, and HVAC components — and comparing each against the actual demand it is serving rather than its design rating — surfaces the specific systems worth optimizing first, and gives plant managers a defensible, quantified business case before committing to a broader deployment.
Frequently Asked Questions: Auxiliary Power Consumption Reduction
Recover Generation Capacity You Already Have
iFactory's AI-driven auxiliary load optimization platform continuously matches pump, fan, compressor, and HVAC output to real operating conditions — recovering 10-20% of station service load as usable net generation capacity, without any change to plant output or reliability posture. Book a Demo to see the recoverable megawatts in your own auxiliary load profile.
Turn House Load Into Dispatchable Capacity.
AI-driven pump, fan, compressor, and HVAC optimization — recovering megawatts your plant is already generating but never sending to the grid.