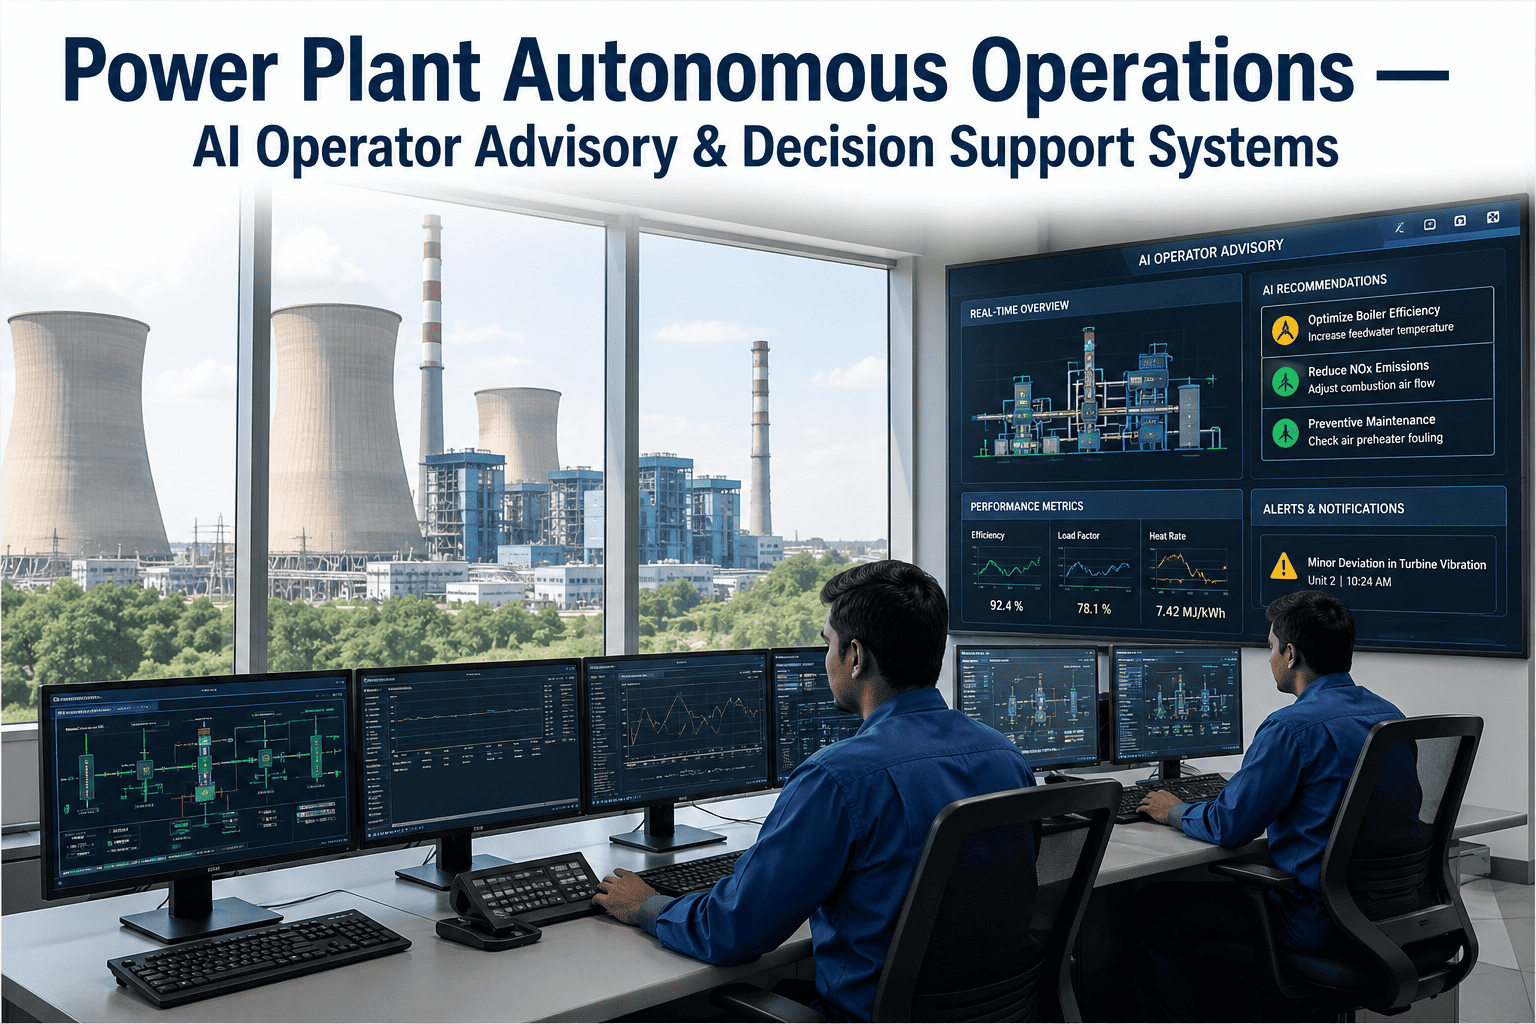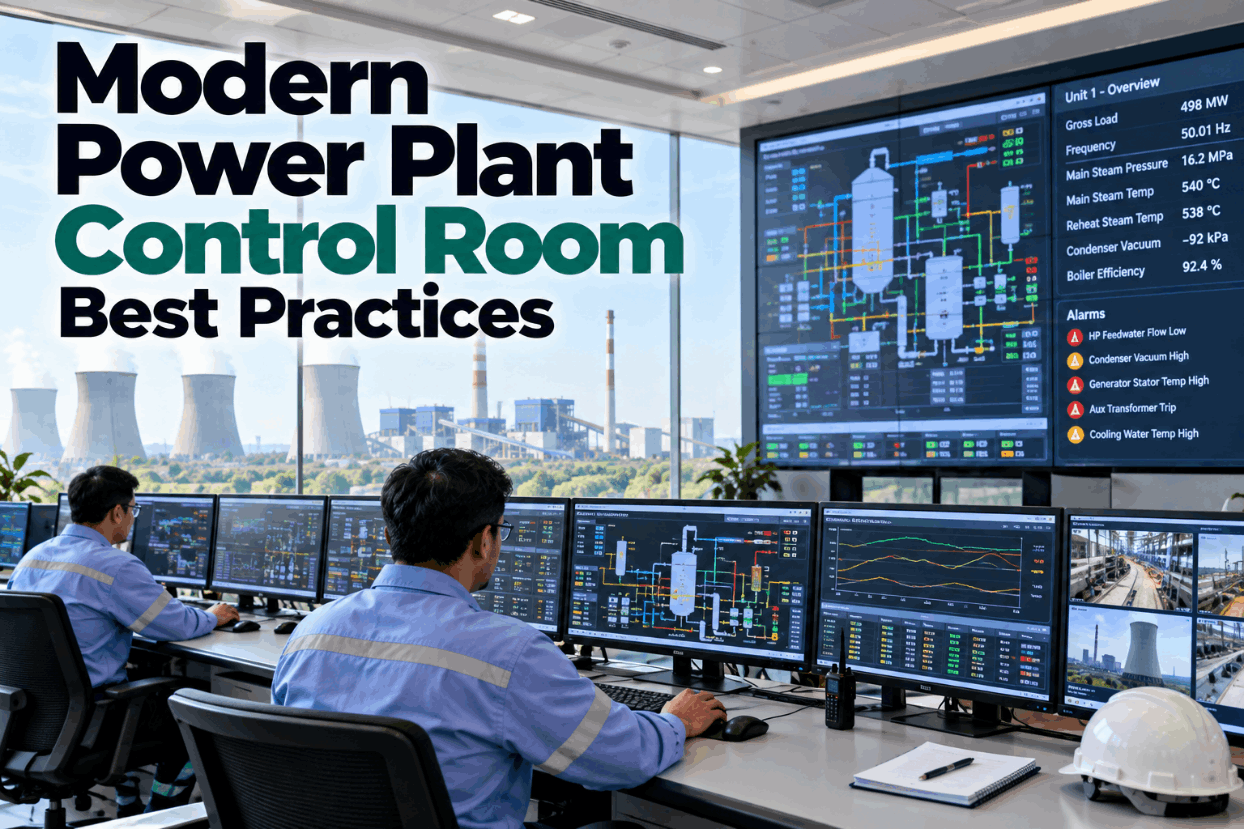
A modern power plant control room is designed around the operator, not the equipment. Screens show what matters, alarms mean something, and the room itself supports twelve hours of steady attention. Many control rooms still do the opposite: hundreds of crowded displays, thousands of alarms a day and layouts inherited from the last retrofit. This guide sets out the best practices for layout, displays, alarms and human factors, with the standards and numbers behind them. To see how your control room compares, book a short walkthrough.
Modern Power Plant Control Room Best Practices: Layout, Alarms and Displays That Help Operators
Fewer, clearer screens. Alarms that need action. A room built for long shifts. The rules that let operators see problems early and respond with confidence.
Layout, displays and alarms should all answer one question: what does the operator need right now?
A small set of well-designed displays beats hundreds of crowded ones.
Power plants often see hundreds of times more alarms than guidance allows.
Industry data points to design and organization far more often than the individual.
What Makes a Power Plant Control Room Modern?
A modern control room helps operators stay aware of the whole plant and act early, with less effort.
Consoles, overview wall and supervisor desk placed for clear sight lines and easy talk.
A plant overview, then unit, then detail, so nobody hunts through pages.
Every alarm has a cause, a response and a priority.
Glare-free light, low noise and stable temperature.
Trends, advisories and procedures at the operator’s side.
Shift patterns, handover and simulator practice.
None of this depends on a brand-new control system. Many of the gains come from redesigning displays and alarms on the system a plant already has.
A structured review shows where your room stands on each of the six. We can run one with you on a call.
Which Standards Apply to Control Room Design?
Five references cover almost everything a power plant needs.
| Reference | What it covers | Use it for |
|---|---|---|
| ISO 11064 | Ergonomic design of control centres, in seven parts | Room layout, workstations, displays, environment, evaluation |
| EEMUA 201 | Guide to control room specification, design and operation, 3rd edition 2019 | Practical sizing and HMI guidance |
| ISA-101 | Human machine interfaces | Display hierarchy and design process |
| ISA-18.2 | Management of alarm systems | Alarm rates, priorities and lifecycle |
| NUREG-0700 | US NRC human-system interface review guidelines, Revision 4 in 2026 | Nuclear plants; a useful reference for others |
These are guides to good practice, not a single rule book. Our specialists map each one to your room.
Control Room Layout Rules
Good layout gives each operator enough space, a clear view of shared displays and easy contact with colleagues.
- Keep the main view low. The normal line of sight is about 15 to 30 degrees below horizontal, per EN 894.
- Put the overview where all can see it. A shared wall display should be readable from every desk.
- Seat the supervisor behind. They should see both the operators and the overview.
- Separate traffic. Permit desks and visitors should not cut across the operating area.
- Plan for people, not peak equipment. Leave room to move, to hand over and to bring in support during an upset.
Environment matters as much as furniture. One summary of ISO 11064 gives comfort ranges of 20–24 °C in winter and 23–26 °C in summer.
A scale drawing with sight lines often reveals problems in minutes. See an example in a demo.
Display Rules: Overview First, Detail on Demand
ISA-101 organizes screens into four levels so operators start with the big picture.
| Level | Purpose | Power plant example |
|---|---|---|
| Level 1 | Overview of the whole area of responsibility | Unit overview: load, steam conditions, key margins, top alarms |
| Level 2 | Main operating display for a system | Boiler, turbine, feedwater, electrical |
| Level 3 | Detail for one piece of equipment | Mill, feed pump, air heater |
| Level 4 | Diagnostics and support | Interlock status, trip logic, procedures |
- Use calm backgrounds. Gray or muted, with color kept for abnormal conditions.
- Show values against limits. Analog indicators with normal ranges beat bare numbers.
- Embed trends. A short trend beside a value shows direction at a glance.
- Avoid red against green. Use shape and text as well as color.
well-designed displays capture most of the benefit of a high-performance HMI, according to an ISA article: one overview, about a dozen operating displays and a few for abnormal situations.
Start with the Level 1 overview. It changes how operators watch the plant. Ask our team for a sample.
Alarm Rules: Fewer, Clearer, Prioritized
Alarm overload is the most common weakness in power plant control rooms.
Guidance figures from ISA-18.2; power plant figure from ABB.
| Measure | Guidance |
|---|---|
| Average alarm rate | About 6 an hour per operator |
| Maximum manageable rate | About 12 an hour |
| Alarm flood | 10 or more alarms in 10 minutes |
| Peak seen in power plants | About 350 alarms in 10 minutes |
ABB notes that people can handle about seven alarms, give or take two, in ten minutes. A peak of 350 is far beyond anyone.
Fixing the ten most frequent alarms usually removes a large share of the load. We rank them in every rollout.
Does Better Design Really Help Operators?
Yes. The best-known study measured large gains with the same operators on a better interface.
The study used 21 professional operators on a simulator at an ethylene plant, so it is not power plant data. The principle carries over: clearer screens let people see trouble sooner and resolve it faster.
A before-and-after test on your own simulator is the best proof. Our engineers can help design one.
Designing for Situation Awareness
Situation awareness has three levels, and a control room should support all of them.
See the key values and changes. Supported by a clear overview and meaningful alarms.
Know what the readings mean together. Supported by values shown against limits and by trends.
Anticipate what will happen next. Supported by rate-of-change displays and predictive advisories.
This model comes from Mica Endsley’s 1995 work and is widely used in control room design.
- Most screens stop at level one. They show data and leave the rest to the operator.
- Trends lift it to level two. Direction and distance from limits become obvious.
- Advisories add level three. Early warnings of drift give time to act before an alarm.
AI advisories fit here: they watch for slow drift that people miss on a long shift. See how they appear on screen in a session.
Shifts, Fatigue and Handover
Even the best screens cannot make up for a tired operator.
- Limit consecutive nights. Risk builds across a run of night shifts.
- Protect breaks. A proper relief is part of the staffing plan.
- Structure the handover. Use the same checklist every time: plant state, open work, abnormal line-ups.
- Light the room for alertness. Adjustable lighting helps on nights without causing glare.
- Train on a simulator. Rare events need practice before they happen for real.
These figures are for industry in general, not control rooms specifically. They still explain why shift design belongs in any control room review.
Discuss shift patterns and handover with our advisors.
Design the System Before Blaming the Operator
Industry data shows that events are far more often caused by organization and design than by an individual slip.
Root causes of 1,007 bulk power system events, 2010–2023, from NERC event analysis data presented by WECC.
NERC also uses a simple model of error rates: about 1 in 10,000 actions for routine skill-based work, 1 in 1,000 for rule-based work and as high as 1 in 2 when people must work things out under pressure.
Clear displays, sound alarms and good procedures all push work back toward routine. A room review shows where yours does not.
Fleet Monitoring Centres
Many generators now add a central monitoring centre that watches every plant for early signs of trouble.
- It supports the control room. The centre spots slow changes; the plant operator stays in charge.
- It shares expertise. A few specialists can cover a whole fleet.
- It pays back. Duke Energy reported one early catch that saved more than $34 million.
Remote operation is also growing. Siemens Energy runs a 300 MW plant at Leipheim entirely from a centre in Erlangen.
A fleet view and a good control room work together. See both in a working session.
Legacy Control Room vs Modern Control Room
The difference is easy to see on a normal shift.
- Hundreds of crowded graphics
- Thousands of alarms a day
- Bright colors everywhere
- Layout fixed by old panels
- Handover by memory
- Operators react to alarms
- A small set of layered displays
- Alarm rate near guidance
- Color only for abnormal states
- Layout built around sight lines
- Structured, recorded handover
- Operators act before alarms
Most plants are somewhere in between. The useful question is which gap to close first. Our safety team can help rank them.
Control Room Best Practice Checklist
A quick self-check for any power plant control room.
Most rooms score lowest on alarms. That is also where improvement is fastest. Start with a pilot.
How iFactory Supports the Modern Control Room
iFactory adds an operator-focused layer on top of your DCS: a clear overview, alarm analysis and early warnings.
One screen with load, margins and top issues.
Rates, floods and the alarms to fix first.
AI advisories for slow drift before alarms.
Structured digital log and checklist.
All units and plants in one place.
Runs on an iFactory server at the plant.
Nothing in your control system is replaced. Share a month of alarm history and we will show the first findings in a trial.
See How Your Control Room Compares
Share a month of alarm history and a few screenshots. We measure alarm load against ISA-18.2 and review your displays against ISA-101.
Alarm rate averaged 27 an hour, with two floods during the mill changeover. Eleven standing alarms have been active for more than a day.
Finding the Alarms That Hide the Real Problem
This is how a shift supervisor might use the analysis.
iFactory ships as a pre-configured NVIDIA AI server, racked and ready with the control room and alarm analytics models loaded. Rack it, plug in power and Ethernet, and the AI is live. Scope covers data connections across units, control room, stores and planning office, DCS, historian, CMMS and ERP integration, cabling and network setup, team training and 24×7 remote monitoring.
Server installed, DCS, historian and CMMS links live, history loaded.
Models tuned on your own plant data, then piloted on one unit with your team reviewing every output.
Rollout to the agreed units, team training done, 24×7 remote monitoring in place.
Software, server and integration come as one package. For pricing, contact our sales team.
Frequently Asked Questions
ISO 11064 for ergonomic design, EEMUA 201 for practical guidance, ISA-101 for displays and ISA-18.2 for alarms. Nuclear plants also use NUREG-0700.
ISA-18.2 guidance treats about 6 an hour as acceptable and about 12 an hour as the maximum manageable. Ten or more in ten minutes is a flood.
EEMUA 201 suggests four screens should be sufficient for the control system at one position, backed by a shared overview display.
In an ASM Consortium simulator study, operators on an improved interface caught 48% of abnormal events before any alarm, against 10%, and resolved situations 41% faster.
NERC event analysis data attributes only about 3.6% of root causes to individual human performance. Organizational and design causes are far more common.
Alarm analysis and a new overview display typically fit within a 6–12 week rollout. Plan it with our specialists.
Give Operators a Control Room That Helps
iFactory adds a clear overview, alarm analytics and early warnings on top of your existing control system, so operators see problems sooner.
Illustrative. ISA-18.2 guidance treats about 6 an hour as acceptable and 12 as the most an operator can manage.