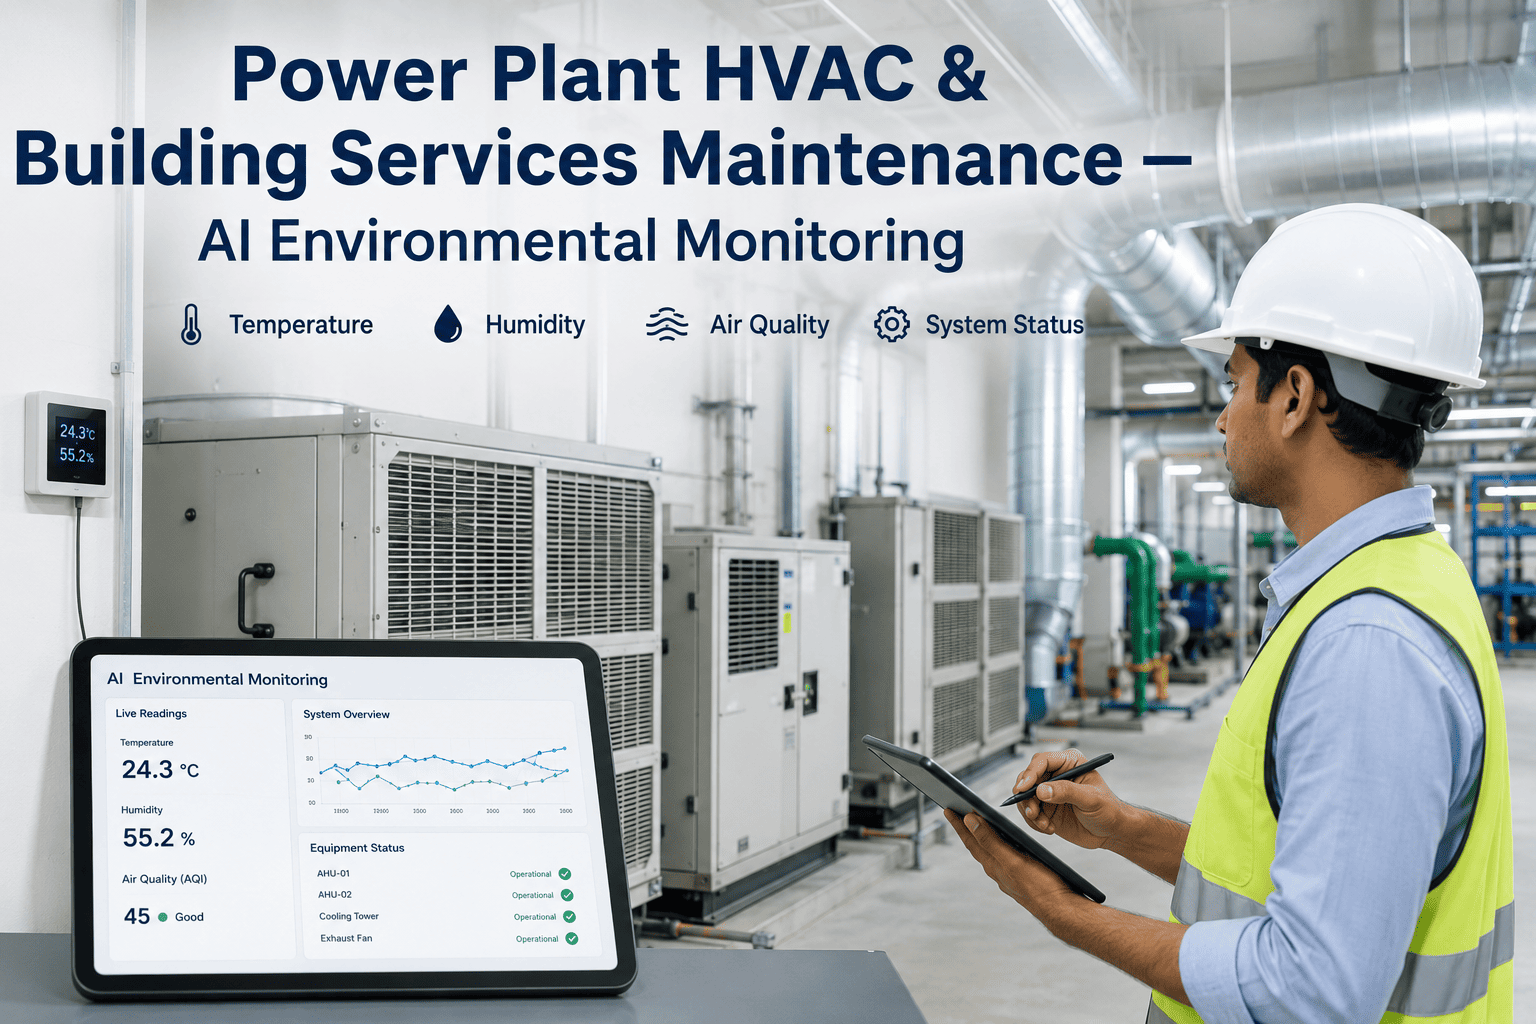
Power Plant HVAC & Building Services Maintenance — AI Environmental Monitoring

By Johnson on July 11, 2026

power-plant-hvac-building-services-maintenance-ai

Power plant HVAC and building services exist in a strange blind spot where reliability engineers can recite the bearing vibration signature of every turbine in the plant but have no idea whether the control room cooling system is degrading until the DCS cabinets start throwing high-temperature alarms. Turbine hall ventilation, switchgear building cooling, battery room exhaust, and control room precision air systems all operate as afterthoughts that get maintained only after they fail, never before. iFactory's AI environmental monitoring treats these building service systems with the same analytical rigor applied to main rotating equipment, tracking performance degradation and predicting failures before they threaten either the safety of your personnel or the operation of your critical control systems. You can book a demo to see how your plant building services look under continuous AI monitoring.

HVAC MONITORING · BUILDING SERVICES · ENVIRONMENTAL CONTROL

The Systems Keeping Your Control Room Alive Are the Same Ones You Are Maintaining With a Clipboard and a Filter Schedule

iFactory monitors every HVAC zone in your power plant as a continuous system, detecting coil degradation, airflow loss, and ventilation drift before they trip your DCS or put your operators at risk.

PLANT ENVIRONMENTAL ARCHITECTURE

Your Power Plant Is Not One Building — It Is Five Different Environmental Zones With Conflicting HVAC Demands

Every power plant structure houses zones with fundamentally different temperature, humidity, and air quality requirements that cannot be met by a single building management approach. The cross-section below maps the typical environmental zones found across a power plant campus and the specific HVAC challenge each one presents to the reliability team responsible for keeping them all functional simultaneously.

Roof Level — Cooling Towers and Air Intakes
Outdoor air quality monitoring, cooling tower drift control, and make-up air intake pre-conditioning that determines the baseline air quality fed to every downstream zone in the plant.
Upper Floor — Control Room and DCS Equipment Rooms
Precision cooling with tight temperature and humidity tolerances for server racks and operator consoles, where a four-degree excursion can trigger equipment protection trips or cause display failures during a plant transient.
Ground Floor — Turbine Hall, Switchgear Rooms, and MCC Buildings
High-volume ventilation for turbine hall heat removal, forced cooling for switchgear and motor control centers where electrical clearance ratings depend on ambient temperature, and combustion air management for boiler auxiliaries.
Basement Level — Battery Rooms and Cable Spreading Areas
Critical exhaust ventilation for hydrogen gas accumulation from battery charging, temperature control to prevent accelerated battery degradation, and cable tunnel ventilation to prevent heat buildup in high-voltage cable runs.
FAILURE CONSEQUENCE BY ZONE

What Actually Happens When Building Services Fail in Each Plant Zone

HVAC failures in a power plant do not just make people uncomfortable. Each zone has a specific failure consequence that escalates from environmental drift to equipment damage to safety hazard in a predictable sequence that the reliability team must understand to prioritize maintenance responses correctly.

CRITICAL CONSEQUENCE

Control Room Precision Cooling Loss

0-30 Min
DCS cabinet temperatures begin rising above alarm setpoints, operator displays start showing thermal warnings on critical plant parameters
30-120 Min
Server thermal throttling reduces DCS scan rates, historian data gaps appear, and operators lose visibility into fast-moving plant transients
2-4 Hours
Automatic equipment protection trips begin firing on high-temperature logic, potentially cascading into a full unit trip from loss of monitoring
SAFETY HAZARD

Battery Room Exhaust Ventilation Failure

During Charge
Hydrogen concentration begins rising in the enclosed battery room as charging generates gas faster than passive diffusion can remove it
1-2 Hours
Hydrogen concentration approaches the lower explosive limit of four percent by volume, triggering area classification alarms if sensors are present
Uncontrolled
Any ignition source in the room, including a static discharge from an operator entering the space, can cause a deflagration event with catastrophic consequences for personnel and adjacent structures
EQUIPMENT RISK

Switchgear Room Cooling Degradation

Gradual
Ambient temperature in the switchgear room slowly climbs as coil fouling reduces cooling capacity, pushing operating temperatures closer to rating limits
Sustained
Breaker and contactor current derating begins as ambient exceeds nameplate rating, reducing the electrical capacity of switchgear that was sized for full load
Peak Load
During high ambient periods combined with peak electrical loading, derated breakers may trip on thermal protection or fail to interrupt a fault within rated capacity
OPERATIONAL IMPACT

Turbine Hall Ventilation Reduction

Early Stage
Reduced airflow from degraded fans or blocked louvers allows radiant heat from the turbine and piping to raise the ambient temperature in the working area
Sustained
Personnel heat stress risk increases, limiting the time technicians can spend performing maintenance tasks in the turbine hall during summer months
Extended
Auxiliary equipment in the turbine hall, such as lube oil coolers and hydraulic power units, operate in higher ambient conditions reducing their own cooling effectiveness and creating compound thermal issues
SEASONAL LOAD DYNAMICS

Why a Fixed Maintenance Schedule Cannot Match Variable HVAC Demand

Power plant HVAC systems experience dramatically different loading across seasons, yet most maintenance schedules treat filter changes, coil cleanings, and belt inspections as calendar-fixed events regardless of whether the system just ran through its hardest month or sat at minimum capacity. The seasonal load profile below shows how demand shifts across the four most critical building service zones.

Control Room Cooling
Switchgear Cooling
Battery Room Vent
Turbine Hall Vent
SPRING


SUMMER


AUTUMN


WINTER


Low Load

Moderate Load

Peak Load
SENSOR DEPLOYMENT PER ZONE

The Minimum Monitoring Points Required to Actually See HVAC Degradation Coming

Most power plants have temperature sensors in their control rooms and battery rooms but lack the density of monitoring needed to detect the early-stage performance losses that precede a complete failure. The grid below maps the specific measurement points the AI model needs per zone to build a reliable degradation trajectory for each building service system.

Environmental Zone Temperature Points Humidity Points Airflow Points Gas Detection Pressure Differential
Control Room and DCS Room Supply, return, cabinet inlet, cabinet exhaust Supply, return, cabinet inlet Supply duct, return duct, each CRAC unit Not required Filter banks, each cooling unit
Switchgear and MCC Buildings Ambient at multiple heights, breaker row inlet Not critical Supply louvers, exhaust fans, each cooling unit Not required Filter banks, ventilation pathway
Battery Rooms Ambient, battery bank surface Not critical Exhaust duct, makeup air inlet H2 concentration at ceiling level, multiple points Room pressure relative to corridor
Turbine Hall Ambient at operating floor, mezzanine, and roof levels Not critical Each supply fan, each exhaust fan, louver openings CO from combustion equipment if applicable Across ventilation louvers and filters
Cable Tunnels and Spreading Areas Ambient at intervals along cable route Not critical Exhaust points, intake points at each zone Not required Across fire dampers and ventilation sections

Your DCS Cabinets Do Not Care That HVAC Is Considered a Building Service — They Will Trip Either Way

iFactory's AI environmental monitoring tracks every critical HVAC zone in your plant with the same analytical depth as your main equipment, so control room cooling loss, battery room ventilation failure, and switchgear overheating are caught before they become emergencies.

REACTIVE VS AI-DRIVEN MONITORING

What You Actually See When You Stop Waiting for an Alarm to Discover an HVAC Problem

Reactive maintenance for building services means the first indication of a problem is the alarm that announces the failure has already occurred. AI-driven monitoring creates a visible degradation trajectory that gives the reliability team weeks of lead time to schedule corrective action during a normal work window instead of an emergency response.

Filter Condition Visibility
Reactive

15%
AI Monitoring

92%
Coil Degradation Detection
Reactive

10%
AI Monitoring

85%
Fan Performance Drift
Reactive

20%
AI Monitoring

88%
Ventilation Rate Verification
Reactive

5%
AI Monitoring

95%
Predictive Maintenance Lead Time
Reactive

0 Days
AI Monitoring

14-21 Days
AI DIAGNOSTIC PATHWAY

How the AI Model Moves From Sensor Data to an Actionable Maintenance Recommendation

The diagnostic pathway below shows the five analytical stages the AI model applies to environmental sensor data before a maintenance recommendation reaches the reliability engineer. Each stage filters noise and adds context so the final output is a specific, actionable finding rather than a raw data alert that requires manual interpretation.

01
Raw Data Ingestion

Temperature, humidity, airflow, pressure differential, and gas concentration readings are collected from every sensor point across all plant environmental zones at configurable intervals and validated for sensor health.


02
Environmental Baseline Calculation

The model establishes the expected environmental baseline for each zone by correlating current readings with outdoor conditions, plant operating load, and time of day to account for normal variation.


03
Deviation Detection and Classification

Measured values that drift from the calculated baseline are flagged and classified by type, whether the deviation indicates a cooling capacity loss, airflow restriction, or sensor fault, to prevent false alarms from legitimate load changes.


04
Root Cause Correlation

Multiple simultaneous deviations across related sensor points are correlated to identify the underlying cause, such as distinguishing between a failed fan, a fouled coil, or a blocked filter producing the same temperature rise symptom.


05
Maintenance Prioritization Output

The identified issue is mapped to a specific maintenance action with a severity rating, an estimated time to functional failure if uncorrected, and a recommended scheduling window based on current plant operating conditions.

MEASURED RESULTS

What Reliability Engineers Report After AI Environmental Monitoring Deployment

The results below reflect outcomes reported by power generation facilities after deploying AI-driven environmental monitoring across their control rooms, switchgear buildings, battery rooms, and turbine hall ventilation systems.

Zero
Unplanned control room cooling failures after deployment, compared to an average of two to three thermal events per year before monitoring was in place
28%
Reduction in HVAC energy consumption from optimizing fan speeds and cooling setpoints based on actual zone demand rather than fixed calendar schedules
14-21 Days
Average lead time between AI detection of a developing HVAC issue and the recommended maintenance window, replacing zero-notice emergency repairs
100%
Battery room hydrogen monitoring compliance achieved with continuous automated logging that replaced manual handheld spot-check readings
FREQUENTLY ASKED QUESTIONS

Questions Reliability Engineers Ask About AI HVAC and Building Services Monitoring

Can the AI model integrate with our existing building management system without replacing it?
The monitoring platform sits above your existing BMS as an analytical layer that ingests data from whatever sensors and controllers are already installed, so there is no need to rip out or reprogram your current building management infrastructure. The AI adds the degradation detection and predictive capabilities that standard BMS platforms do not provide, while your BMS continues handling its existing control and alarm functions without any change to its configuration or wiring. Book a demo to see BMS integration for your plant configuration.
What happens if we do not have enough sensors in some zones to support the AI model?
The system performs a sensor gap analysis during the initial assessment that identifies exactly which measurement points are missing for each zone and recommends the minimum additional sensors needed to achieve reliable monitoring coverage. In most cases the gaps are concentrated in airflow measurement and pressure differential points that are inexpensive to add, and the model can begin providing partial degradation detection in zones with existing sensors while the additional points are being installed. Contact our support team for a sensor gap assessment of your plant zones.
Does the system monitor HVAC systems during plant outages when the main equipment is not running?
Environmental monitoring continues during outages because several critical zones, particularly battery rooms and cable spreading areas, require continuous ventilation regardless of whether the main generating unit is online or offline. The AI model actually uses outage periods as valuable baseline calibration windows because the absence of process heat load creates stable environmental conditions that make it easier to detect small HVAC performance deviations that would be masked during normal operation. Book a demo to see how outage periods are used for calibration.
How does the model distinguish between a real HVAC problem and a sensor reading that drifted out of calibration?
The model runs continuous sensor health checks by comparing each reading against correlated sensors in the same zone and against the expected environmental response to known conditions like outdoor temperature changes and plant load variations. When a single sensor shows a deviation that is not corroborated by any other measurement in the same zone or by the expected physical response, the system classifies it as a suspected sensor fault rather than an environmental deviation and routes it to a sensor maintenance queue instead of an HVAC maintenance queue. Contact our support team to discuss sensor validation logic for your installation.
Can we extend the monitoring to administrative buildings and other non-critical areas using the same platform?
The platform supports any building zone with environmental sensor data, so administrative buildings, workshops, warehouse spaces, and cafeteria areas can be added to the same dashboard that monitors your critical plant zones. Non-critical areas use the same analytical engine but with different alarm thresholds and maintenance prioritization levels, so a comfort complaint in an office building never generates the same urgency as a temperature excursion in a DCS equipment room, but the degradation tracking and energy optimization benefits still apply. Book a demo to see multi-zone dashboard configuration.

Your Plant Does Not Have a Building Services Problem Until It Does, and Then It Is an Emergency

iFactory's AI environmental monitoring watches every HVAC zone in your plant continuously, detecting the degradation that precedes control room cooling loss, battery room ventilation failure, and switchgear overheating weeks before they become emergencies.

Share This Story, Choose Your Platform!