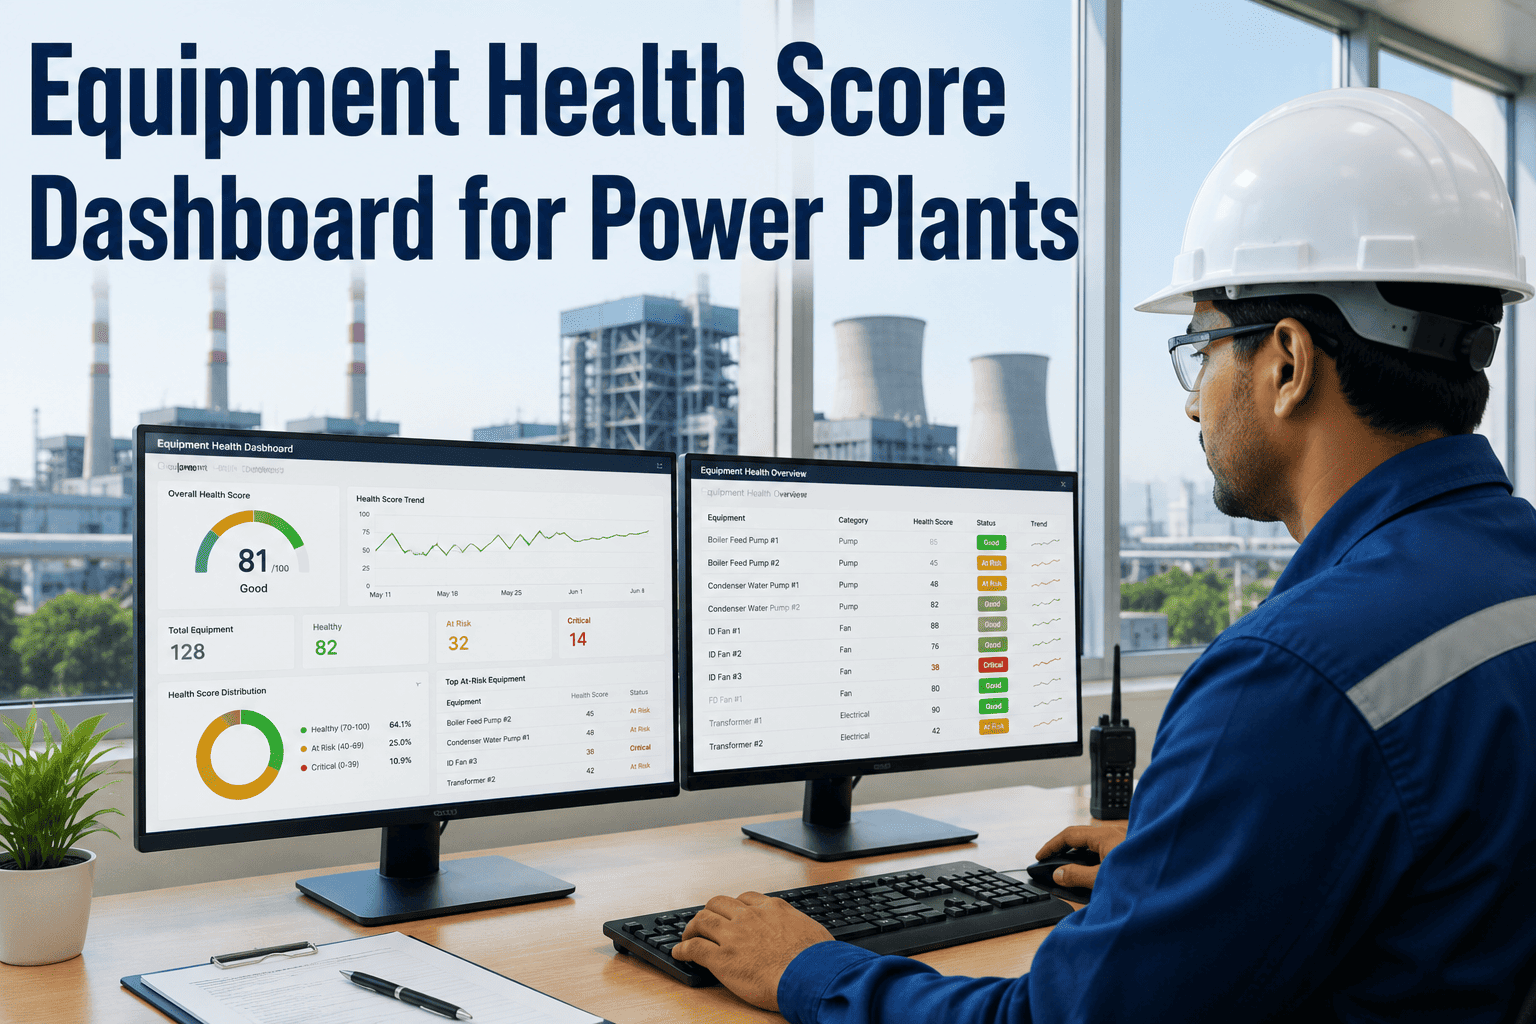
Power plant control rooms generate thousands of raw sensor alarms during transient events, and operators trained to react to these floods inevitably develop alarm fatigue that masks the early warning signs of genuine mechanical degradation. A composite equipment health score dashboard resolves this by aggregating vibration, temperature, performance, and oil analysis data into a single calculated index per asset, replacing a wall of blinking red indicators with a clear prioritized list of which machines are actually failing. Reliability engineers ready to replace raw alarm flooding with actionable health indices can book a demo to see how composite scoring is calculated and visualized in real time.
EQUIPMENT HEALTH SCORE · PREDICTIVE FAULT DETECTION · POWER PLANT
Real-Time Equipment Health Score Dashboards for Power Plants
How to aggregate vibration, thermal, oil analysis, and performance data into a single composite health index that cuts through alarm noise and shows operators exactly which assets are degrading.
The Alarm Crisis in Power Plant Operations
The ISA 18.2 standard recommends a maximum of 144 alarms per operator per hour, yet during unit trips or load swings, power plant control rooms routinely exceed fifteen hundred alarms in the same window. This alarm flood does not improve situational awareness. It destroys it by burying the one or two critical alarms that indicate an actual mechanical fault beneath hundreds of transient threshold violations that resolve themselves within seconds. The root cause is not operator incompetence but a fundamental architectural flaw in how plant monitoring systems are configured, where every sensor is given an independent alarm threshold without any context about the health of the equipment it is attached to.
1,500+
Alarms Per Hour During Transients
During a load rejection or turbine trip, raw sensor thresholds trigger in cascading sequences that overwhelm operator cognitive capacity within the first thirty seconds of the event.
73%
Of Alarms Are Chattering or Standby
EEMUA 191 studies consistently show that the vast majority of configured alarms in power plants are either nuisance alarms, redundant alarms, or alarms for conditions that require no operator action.
4-6 Hours
Average Delay to Diagnose Root Cause
When a genuine fault occurs amid an alarm flood, operators spend hours scrolling through alarm logs to reconstruct the sequence of events and identify the initiating failure device.
$45-120K
Cost of Unnecessary Emergency Shutdown
Alarm fatigue contributes to premature trips where operators shut down a unit because they cannot distinguish a genuine emergency from a sensor fault or transient excursion.
Anatomy of a Composite Equipment Health Index
A composite equipment health index is a single numerical value, typically scaled from zero to one hundred, that represents the aggregate condition of a machine based on multiple independent measurement systems. Unlike a raw sensor reading that only tells you about one parameter at one point in time, the health index fuses vibration signatures, thermal profiles, lubricant condition, and performance efficiency into a single trendable number. When the score drops from ninety-five to eighty over three weeks, the reliability engineer knows the machine is degrading even if no individual sensor has tripped its alarm threshold yet.
Vibration Signature
Overall velocity, acceleration, and displacement values combined with spectral analysis to detect imbalance, misalignment, bearing defects, and structural resonance. Vibration is the highest-weighted input for rotating equipment because it responds earliest to mechanical degradation before thermal or performance effects become measurable.
Thermal Profile
Bearing temperatures, winding temperatures for motors and generators, and process fluid temperatures compared against design baselines adjusted for current load and ambient conditions. Thermal deviations that persist after load normalization indicate fouling, cooling system degradation, or friction-induced heating that vibration alone may not explain.
Oil Analysis Metrics
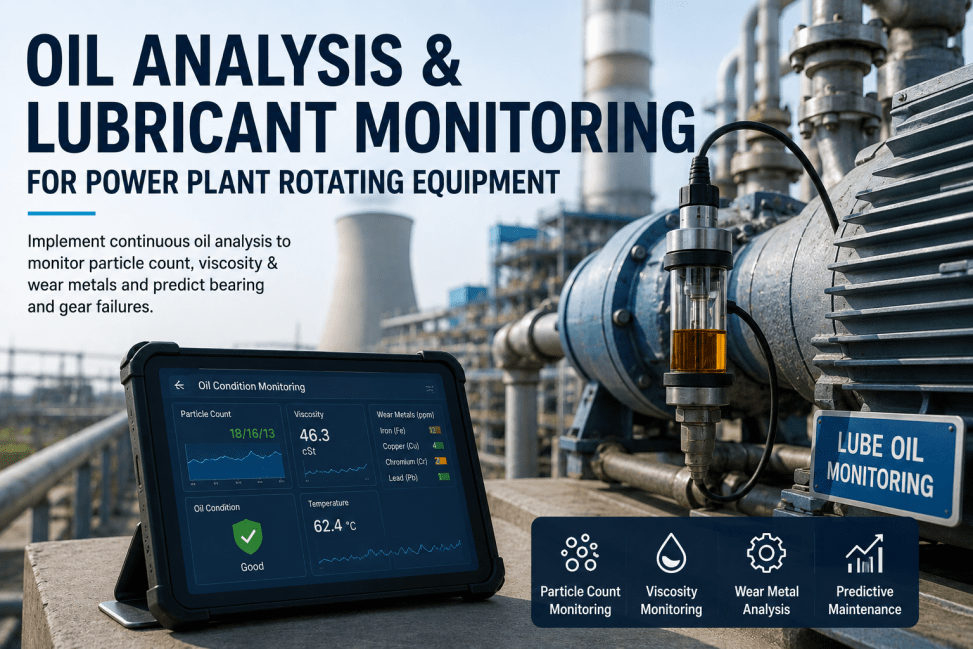
Particle count, wear metal concentration, moisture content, acid number, and viscosity trends from periodic or online oil sampling. Oil analysis provides direct evidence of the degradation mechanism by identifying the specific metals present in the lubricant, which narrows the fault diagnosis to a specific bearing, gear set, or wear surface.
Performance Efficiency
Flow rates, pressure differentials, power consumption, and heat rate for turbines and pumps compared against their original design curves or post-overhaul baseline curves. Performance degradation often indicates fouling, erosion, or internal recirculation that has not yet produced measurable vibration or thermal anomalies.
The Health Score Calculation Pipeline
Calculating a reliable composite health score requires a multi-stage data pipeline that transforms raw sensor outputs into normalized, weighted, and time-filtered indices. Skipping any stage in this pipeline produces a health score that is either too noisy to be useful or too slow to detect emerging faults. The pipeline below represents the standard processing sequence that produces a stable and sensitive health index suitable for power plant operator dashboards.
01
Raw Data Ingestion
Collect time-stamped data streams from vibration sensors, RTD inputs, online particle counters, and DCS performance calculations at their native scan rates ranging from one second to one hour depending on the measurement type.
02
Normalization
Convert all parameters to a zero-to-one-hundred scale where one hundred represents the as-new or post-overhaul baseline condition and zero represents the alarm or failure threshold for that specific parameter under current operating conditions.
03
Weighted Fusion
Multiply each normalized parameter score by its assigned weight based on the equipment type and fault sensitivity, then sum the weighted scores to produce a single composite value. Weights are tuned per asset class during initial commissioning.
04
Time Filtering
Apply a rolling average or exponential smoothing function over a configurable time window to suppress transient spikes from operational events like load changes while preserving the trend direction from genuine degradation mechanisms.
05
Composite Index Output
Publish the final zero-to-one-hundred health score to the operator dashboard, historian, and alerting system with a calculated rate-of-change value and a projected time-to-threshold based on the current degradation trend.
Health Index Weighting by Power Plant Equipment Class
The relative importance of each data input varies significantly by equipment type. A steam turbine health score relies heavily on vibration and thermal data because bearing and blade failures manifest in those parameters first. A large transformer health score relies more heavily on dissolved gas analysis and thermal profiling because electrical insulation degradation does not produce measurable vibration. The following matrix provides the baseline weighting structure for common power plant equipment classes, which must be tuned during initial deployment based on site-specific failure history and available instrumentation.
| Equipment Class | Vibration Weight | Thermal Weight | Oil Analysis Weight | Performance Weight |
|---|---|---|---|---|
| Steam Turbines (HP/IP/LP) | 40% | 30% | 15% | 15% |
| Boiler Feedwater Pumps | 45% | 25% | 20% | 10% |
| Forced Draft / Induced Draft Fans | 50% | 15% | 20% | 15% |
| Large Power Transformers | 5% | 35% | 45% | 15% |
| Coal Handling Conveyor Gearboxes | 45% | 15% | 30% | 10% |
| Cooling Water Pumps | 40% | 20% | 15% | 25% |
Health Score Thresholds and Response Protocols
A health score is only valuable if it is tied to a clear response protocol that tells operators and reliability engineers what to do at each degradation level. The threshold structure below defines four operational bands with specific diagnostic and response actions for each band. These thresholds are not fixed alarm setpoints but conditional triggers that account for the rate of change of the health score, because a machine at eighty that is stable is less urgent than a machine at eighty that was at ninety-five two days ago.
90-100
Healthy
Equipment is operating within normal degradation expectations for its age and operating hours. No corrective action required. Standard monitoring interval maintained. Health score trend is flat or declining at less than one point per month, which is consistent with normal wear progression.
70-89
Watch
Early degradation detected through one or more parameter inputs trending away from baseline. Diagnostic analysis initiated to identify which measurement system is driving the score decline. Vibration spectra reviewed, oil sample pulled for expedited analysis, and thermal imaging scheduled for next available outage window. No operational restrictions applied yet.
50-69
Alert
Confirmed degradation pattern with multiple parameter inputs contributing to the score decline. Fault diagnosis required within forty-eight hours to determine root cause and remaining useful life. Operating limits may be imposed such as load restrictions, speed reductions, or increased monitoring frequency. Maintenance planning activated to schedule repair or replacement at the next available opportunity.
Below 50
Critical
Imminent failure risk with health score declining at an accelerating rate indicating progressive damage. Immediate operational response required which may include controlled shutdown, load transfer to redundant equipment, or emergency trip depending on the fault severity and the consequence of an uncontrolled failure. Failure mode and effects analysis reviewed to confirm safe shutdown procedure.
Dashboard Visualization Architecture
The visual design of the health score dashboard determines whether operators actually use the system or ignore it in favor of their familiar alarm summary screens. A well-designed dashboard presents information at three levels of detail that allow the operator to assess the entire fleet at a glance and drill down to specific parameter data when an anomaly is detected. The architecture below defines the three visualization layers and what each layer must display to be effective in a power plant control room environment.
Level 1: Fleet Overview
A single screen displaying every monitored asset as a tile or node colored by its current health score band. Green tiles for healthy assets, yellow for watch, orange for alert, and red for critical. The fleet view must be scannable in under five seconds so that the operator immediately sees if any asset has entered a degraded state. Sorting options allow the fleet view to rank assets by lowest score or fastest rate of decline rather than by unit number or alphabetical order.
Level 2: Asset Detail
Clicking a degraded tile opens the asset detail view showing the composite health score as a prominent gauge or numerical display, the four input parameter scores as individual bar charts or trend lines, and a thirty-day trend of the composite score with the rate of change calculated and displayed. This view answers the operator's first two questions: how bad is it, and how fast is it getting worse. The asset detail view also displays the current operating context including load, speed, and time since last maintenance.
Level 3: Parameter Diagnostics
Clicking a specific parameter bar opens the raw diagnostic data for that measurement system. For vibration, this shows the overall trend plus the current frequency spectrum with fault frequencies marked. For temperature, this shows the current reading against the load-adjusted baseline. For oil analysis, this shows the trending wear metal concentrations. This level is designed for the reliability engineer rather than the operator, providing the technical depth needed to diagnose the root cause of the health score decline.
Power Plant Equipment Health Applications
The specific parameters that feed the health score calculation vary by equipment type, and understanding these variations is critical for configuring the dashboard to provide meaningful scores rather than noise. The following breakdown maps the health score inputs to specific power plant equipment categories, detailing which measurements matter most for each asset class and what degradation mechanisms the health score is designed to detect.
Steam Turbines
Health score inputs include bearing vibration overall and spectral data at DE and NDE positions, bearing metal and return oil temperatures, differential expansion between rotor and casing, valve position feedback for hunting detection, and steam consumption per megawatt for efficiency trending. The primary fault modes the turbine health score detects are bearing degradation through vibration and temperature fusion, blade fouling or erosion through efficiency decline, and alignment shifts through changes in the axial vibration profile during load transitions.
Boiler Feedwater Pumps
Health score inputs include vertical and horizontal vibration at bearing locations, suction and discharge pressures, motor winding temperatures, pump casing temperature differential, flow rate versus speed curve deviation, and oil particle count from the lube system. The primary fault modes detected are journal bearing wear through vibration and oil analysis fusion, internal recirculation through performance curve deviation at constant speed, and seal degradation through temperature differential changes between the pump casing and the seal flush system.
Generator and Exciter Systems
Health score inputs include stator winding temperatures by section, rotor vibration, hydrogen cooler effectiveness, hydrogen gas purity and pressure, exciter voltage and current balance, and partial discharge monitoring if installed. The primary fault modes detected are stator insulation degradation through thermal trending and partial discharge fusion, rotor winding shorted turns through vibration changes at specific load points, and hydrogen cooler fouling through thermal performance degradation relative to clean-baseline curves.
Cooling Tower Fans and Gearboxes
Health score inputs include fan blade vibration, gearbox input and output shaft vibration, gearbox oil temperature, oil analysis wear metal trends, motor current signature for blade imbalance detection, and approach temperature for cooling performance. The primary fault modes detected are gearbox bearing and gear tooth wear through vibration and oil analysis fusion, fan blade imbalance or corrosion through vibration and current signature, and fill media fouling through approach temperature degradation that affects the performance score component.
The Math Behind Reliable Health Scores
A health score that fluctuates wildly every time the unit changes load is worse than no health score at all because it trains operators to ignore it. The mathematical foundation of the scoring algorithm must account for three critical factors that raw alarm systems ignore: operating condition normalization, data quality weighting, and temporal smoothing. Each of these factors plays a specific role in producing a stable and sensitive composite index that operators can trust.
Operating Condition Normalization
A bearing temperature of ninety degrees Celsius is normal at full load but may indicate a cooling system problem at half load. The normalization stage adjusts the alarm threshold and the baseline score for each parameter based on the current operating point, typically load for turbines and generators or flow rate for pumps. Without this normalization, the health score would drop every time the unit ramps down simply because the thermal and performance parameters move away from their full-load baselines, creating false degradation indications that destroy operator confidence in the system.
Data Quality and Availability Weighting
When an online oil particle counter is offline for calibration, the health score algorithm must not simply drop the oil analysis weight to zero and recalculate, because that would make a machine with a failed sensor appear healthier than an identical machine with a working sensor. Instead, the algorithm substitutes the last known valid reading with a decaying confidence factor, or substitutes a population average for that equipment type, while flagging the score as calculated with reduced data confidence so the operator knows the oil analysis input is stale.
Temporal Smoothing and Rate of Change
An exponential moving average with a configurable time constant, typically set to twenty-four to seventy-two hours for power plant rotating equipment, suppresses transient spikes from operational events while preserving the trend direction from genuine degradation. The rate of change of the smoothed score is calculated as a derivative and displayed alongside the absolute score because a machine at eighty-five that is declining at two points per week is far more concerning than a machine at seventy that has been stable for six months. The rate of change is often more useful for prioritizing maintenance work than the absolute score itself.
Reliability Engineers Ask
How is a composite health score different from a traditional alarm system?
A traditional alarm system evaluates each sensor independently against a fixed threshold, which means a machine with five parameters all trending toward their alarm limits simultaneously generates zero alarms until the first one trips, at which point the operator sees one alarm and has no context about the other four. A composite health score evaluates all parameters simultaneously and calculates a weighted aggregate that begins declining as soon as multiple parameters start deviating from their baselines, even if no individual parameter has reached its alarm threshold. This provides weeks or months of early warning that a traditional alarm system cannot deliver because it is designed to detect threshold crossings, not gradual trends. Teams can book a demo to see this early warning capability in action.
What happens when a sensor fails or provides bad data?
The health score algorithm handles bad data through a quality-weighted substitution approach rather than simply ignoring the missing input. When a sensor is flagged as failed or out of range, the algorithm substitutes the last valid reading with an exponentially decaying confidence factor, or uses a statistical estimate based on the remaining healthy inputs and the historical correlation between parameters for that equipment type. The dashboard displays a data quality indicator alongside the health score so that operators know the score is being calculated with reduced input confidence, preventing them from making maintenance decisions based on a score that is missing a critical data source.
How long does it take to commission a health score dashboard for an entire power plant fleet?
Commissioning a fleet-level health score dashboard typically requires eight to fourteen weeks depending on the number of asset classes, the availability of historical baseline data, and the maturity of the existing sensor infrastructure. The first phase involves connecting to the data historians and DCS systems to validate data quality and availability for each tagged parameter. The second phase configures the normalization logic and baseline profiles for each equipment type under various operating conditions. The third phase tunes the weighting factors by reviewing historical failure events and adjusting the algorithm until the health score would have provided early warning for those known failures. Reach out to support to discuss a commissioning timeline tailored to your specific fleet size and data infrastructure.
Can the health score system integrate with our existing CMMS for work order generation?
Yes, the health score system should integrate with the CMMS through an automated threshold trigger that generates a work request when an asset enters the alert band or when the rate of change exceeds a configured limit. The work request should include the current health score, the parameter or parameters driving the decline, the calculated rate of change, and the suggested diagnostic actions based on the fault signature. This integration closes the loop between condition monitoring and maintenance execution by ensuring that every degraded asset automatically enters the maintenance planning queue with the diagnostic context that planners need to prioritize and scope the work correctly.
Does the health score work for equipment that operates at variable speeds and loads?
Variable speed and variable load equipment is actually where the health score provides the most value compared to traditional fixed-threshold alarms, precisely because fixed thresholds are almost useless for equipment that operates across a wide range of conditions. The operating condition normalization stage of the pipeline adjusts the expected baseline for each parameter based on the current speed or load, so the health score reflects the deviation from the expected condition at that specific operating point rather than deviation from a single fixed setpoint. This means a variable speed fan running at forty percent speed is evaluated against the expected vibration and temperature profile for forty percent speed, not against the full-speed alarm limits that would generate false alarms during normal low-load operation.