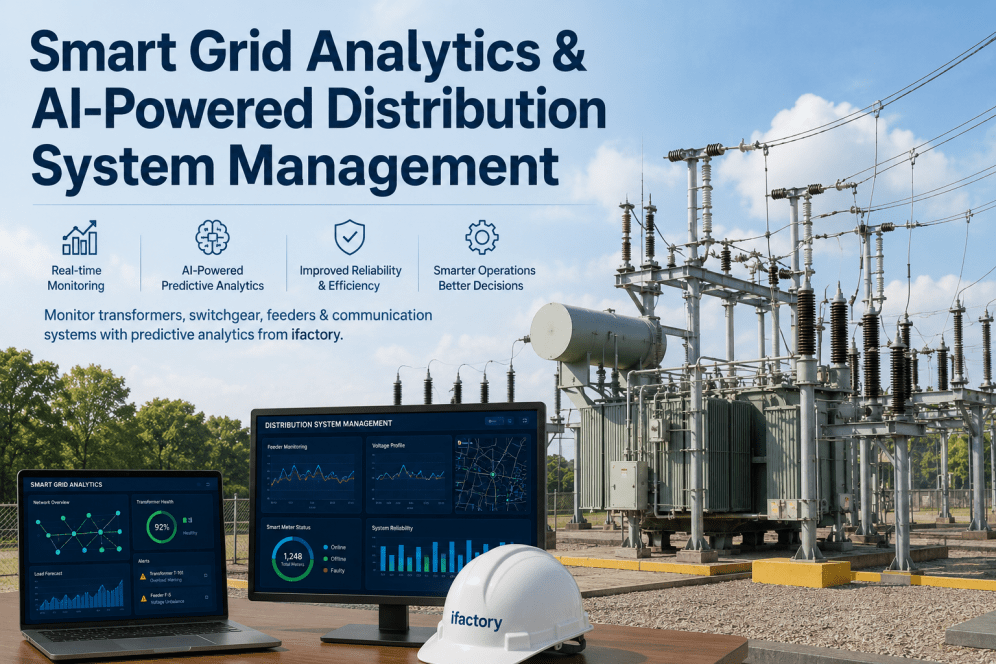
In a modern electric utility, the distribution network moves more data than power—yet most distribution management systems still rely on SCADA polling intervals measured in minutes, not seconds. see how iFactory's AI-driven Distribution System Management delivers real-time visibility and predictive intelligence across your entire grid, Book a Demo with our energy engineering team today.
The Blind Spot in Distribution Network Management
Why Feeder Monitoring Without AI Is a Costly Gamble
Distribution utilities have invested billions in AMI smart meters, substation RTUs, and feeder reclosers, yet most still operate with a fundamental "Visibility Gap." The average distribution feeder is monitored at the substation breaker and possibly at one or two mid-line sectionalizing points—leaving miles of cable, dozens of transformers, and hundreds of service drops completely dark between readings. A 5% voltage imbalance that signals a failing regulator or a 15°C temperature rise in a pad-mounted transformer often goes unnoticed until protective devices operate or customers call. This gap is not a technology problem.
5 Root Causes of Distribution System Analytics Failure
Diagnosing the Visibility Gap in Your Distribution Operations
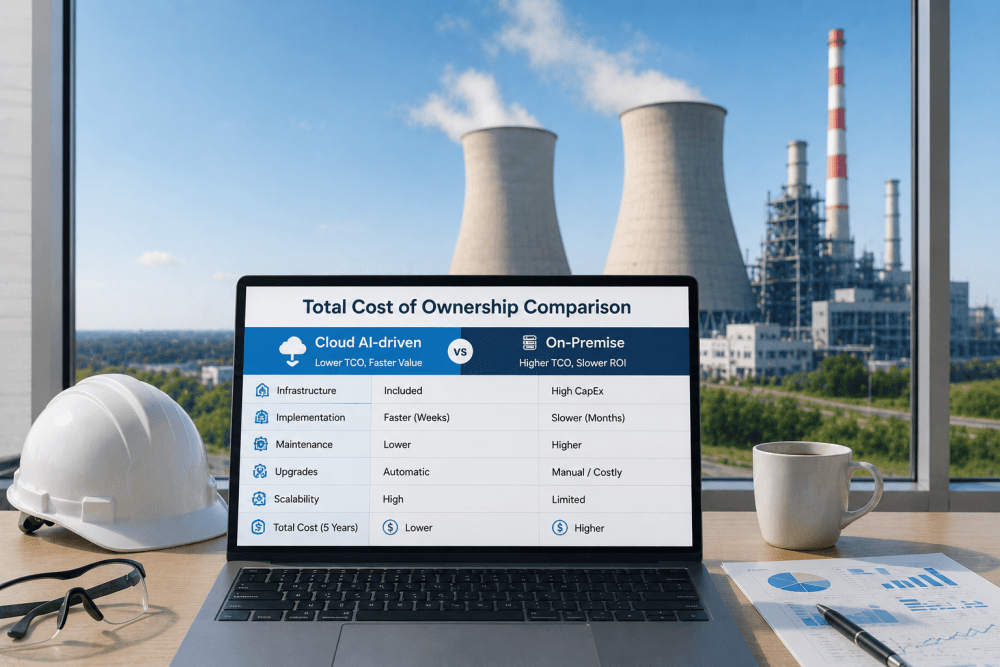
The True Cost of Grid Visibility Gaps
Annualized Risk Profile of Common Distribution System Failure Modes
When distribution assets operate without continuous analytics, every failure mode carries a probability curve that shifts from "monitorable" to "critical" faster than periodic inspections can track. The table below outlines the annualized risk and cost impact of the most common failure modes in a mid-size utility distribution network serving 150,000 customers.
| Failure Mode | Primary Asset Impact | Secondary Operational Risk | Annualized Cost Range |
|---|---|---|---|
| Transformer Overload | Insulation Degradation | Extended Customer Outage | $85K – $220K |
| Switchgear PD Flashover | Catastrophic Arc Fault | Substation Fire / Safety Hazard | $250K – $680K |
| Feeder Fault (Tree Contact) | Conductor Damage | Wildfire Ignition Risk | $60K – $180K |
| Voltage Regulator Failure | Voltage Sags / Swells | Customer Equipment Damage Claims | $40K – $120K |
| Underground Cable Degradation | Permanent Cable Fault | Extended Excavation / Repair | $110K – $350K |
What AI-Powered Distribution Management Requires
The Architecture of a "Grid Intelligence" Digital Twin
Genuine real-time distribution analytics requires four core architectural pillars: 1. Multi-Source Data Fusion that combines SCADA, AMI, GIS, and IoT sensor streams into a coherent operational model; 2. Predictive Load and Asset Modeling using physics-informed machine learning to forecast transformer temperatures, feeder loading, and voltage profiles; 3. Automated Fault Detection and Localization that analyzes current signatures, recloser operations, and protection events to pinpoint faulted sections within seconds; and 4. Grid-Edge Communication Monitoring that tracks the health of RTUs, smart meters, and communication links to prevent data loss. Platforms that only aggregate SCADA data are missing 70% of the predictive opportunity in distribution system management.
The 5-Step Framework for Distribution System Optimization
Safety & Regulatory Risk in Distribution Management
Arc Flash, Wildfire Prevention, and Grid Reliability Compliance
In distribution system management, reliability and safety are inseparable. A switchgear arc flash event or a downed conductor during a dry season fire risk day represents both a life-safety emergency and a regulatory liability. iFactory's "Distribution Safety" layer correlates fault current signatures, weather data, and equipment health metrics to provide high-confidence alerts for potential arc flash conditions, degrading insulation, and wildfire ignition risks. This automated surveillance provides a level of risk mitigation that manual inspection cycles cannot match. For distribution operations managers, iFactory is not just an efficiency platform—it is a critical component of the utility's reliability and safety management system (SMS). Book a Demo to see our distribution safety automation in action.
Frequently Asked Questions
What is "distribution system analytics" and how is it different from transmission analytics?
Distribution analytics focuses on the medium- and low-voltage network between the substation and the customer meter. Unlike transmission systems—which have dedicated protection relays, phasor measurement units, and redundant monitoring—distribution networks rely on fewer sensors with longer polling intervals. AI-driven distribution analytics compensates for this sparse instrumentation by correlating AMI, SCADA, and operational data to infer asset conditions across the entire feeder.
How does iFactory detect faults without installing additional line sensors?
iFactory uses a technique called "Feeder Signature Analysis." By correlating the current and voltage waveforms at the substation breaker with AMI interval data and recloser event logs, the AI can identify the fault type, approximate location, and impacted customer count within seconds—without requiring additional field sensors or line monitors.
Can iFactory integrate with our existing ADMS, SCADA, and AMI systems?
Yes. iFactory is designed as an analytics overlay that integrates with existing ADMS (Distribution Management), SCADA, AMI head-end, GIS, and OMS platforms via standard APIs (DNP3, IEC 61850, Modbus, REST, and MQTT). No rip-and-replace required. Typical integration timelines range from 4 to 8 weeks depending on existing infrastructure Book a Demo .
How much can AI-driven analytics actually reduce outage duration?
Utilities deploying AI-based fault detection and localization typically see a 30–50% reduction in Customer Minutes of Interruption (CMI) for distribution faults. The primary driver is faster fault location—reducing the "search time" from an average of 45–90 minutes down to under 5 minutes for most fault types.
Is iFactory compatible with legacy reclosers, regulators, and non-smart transformers?
Yes. iFactory integrates with existing distribution automation equipment using available communications (DNP3, Modbus, serial). For non-communicating legacy devices, we ingest operational data from SCADA event logs and AMI feeder-level measurements to build health models. The platform is also compatible with modern IEC 61850-based substation architectures.