A reliability engineer chasing a load-response complaint already knows how this investigation usually goes: the DCS trend looks fine on average, the turbine is holding setpoint, and yet operators keep reporting a sluggish response every time the unit is asked to ramp. Nobody wrote a work order because nothing has failed yet. A control valve that sticks for half a second before breaking free, an actuator that drifts a fraction of a percent off command, or a governor loop that hunts slightly wider than it did last quarter — none of these trip an alarm, but together they are exactly the pattern that precedes a forced outage on the governor system. iFactory tracks valve stroke, actuator response, and governor loop behavior continuously and flags the drift long before it becomes a trip, and you can book a demo to see it run against your own turbine's control history.
Governor Instability Rarely Announces Itself — It Builds Quietly Inside a Loop That Still Looks Stable
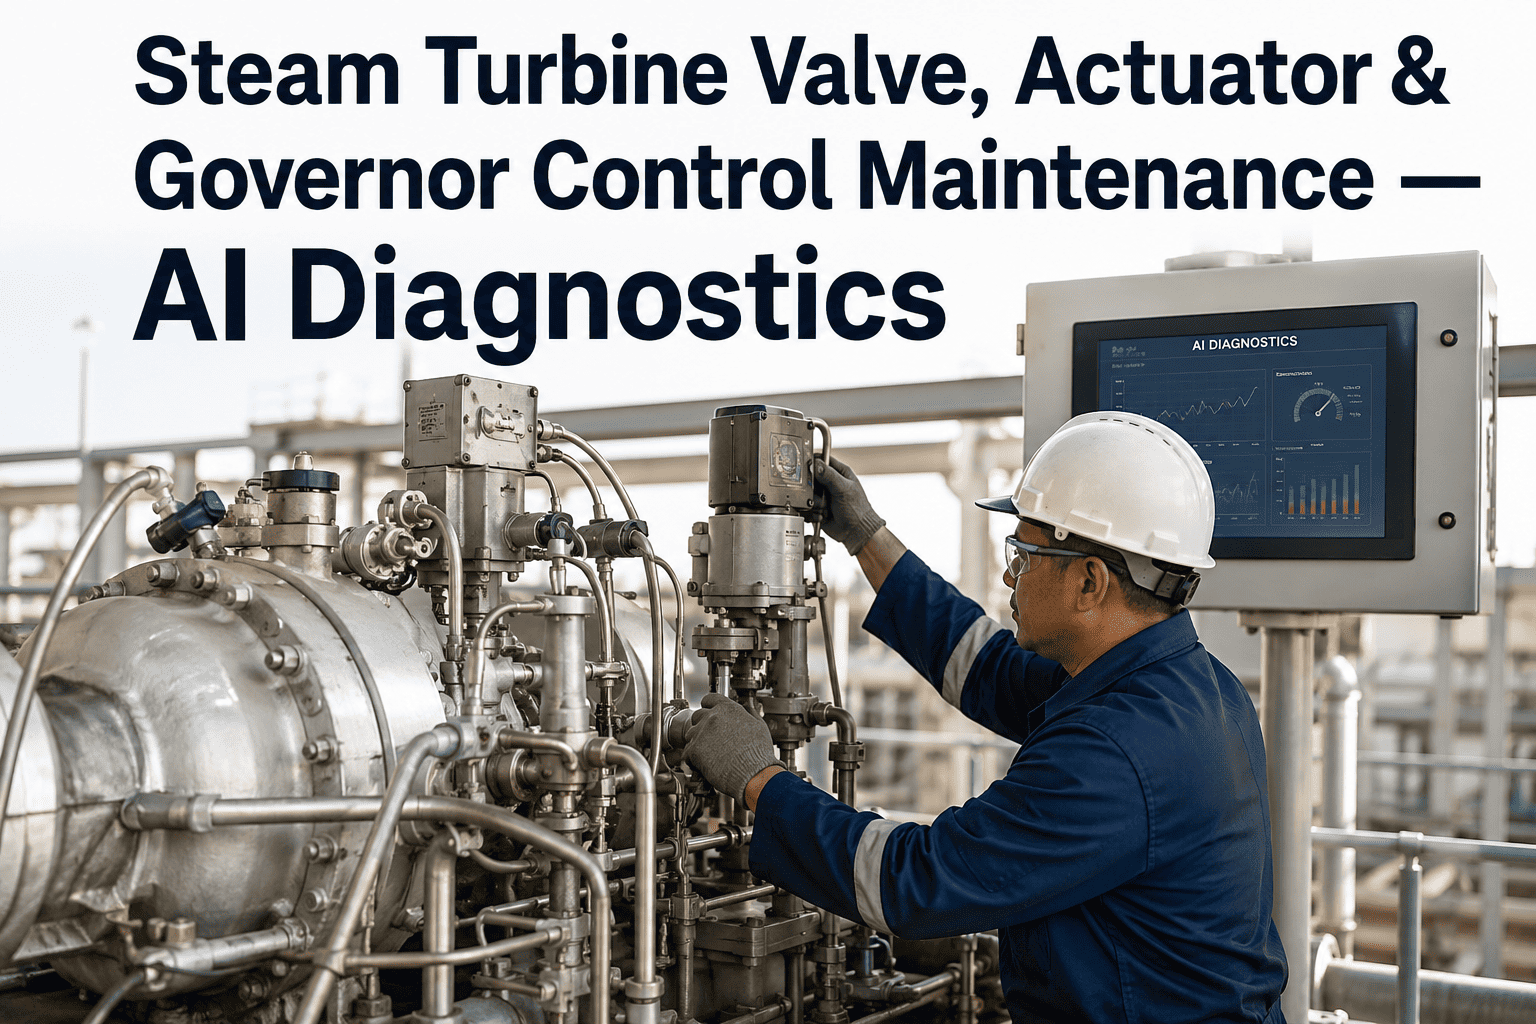
iFactory applies AI diagnostics to control valve stroke, actuator command-versus-feedback error, and governor loop response, catching the early signature of valve sticking, actuator drift, and hunting long before load response degrades or a trip occurs.
Valve Sticking, Actuator Drift, and Governor Hunting Share the Same Root Problem
Each of these failure modes has a distinct mechanical cause, but they share one thing in common: on a standard control room trend, all three look like normal noise until the deviation is already large enough to affect unit performance.
Valve Sticking
Stem friction from deposits, seal degradation, or bushing wear causes a control valve to hesitate before responding to a command, producing a small dead-band that widens as deposits build.
Actuator Drift
Hydraulic or electro-hydraulic actuators lose precision as internal wear, oil contamination, or feedback sensor degradation causes the actual valve position to diverge from the commanded position.
Governor Instability
As valve and actuator response degrades, the governor loop compensates with larger corrective moves, and the resulting oscillation — hunting — becomes visible in load response well before any single component alarms.
From Raw Stroke Data to a Ranked List of Valves Worth Inspecting
The diagnostic does not wait for a valve to fail a stroke test. It builds a continuous picture of command-versus-response behavior and ranks every valve, actuator, and loop by how far its current behavior has moved from its own healthy baseline, using the same signals the control system already historizes rather than requiring a separate data collection effort.
Baseline Capture
Command, position feedback, and loop error are logged for every governor valve during a known-healthy operating window.
Continuous Comparison
Every stroke is compared against baseline response time, overshoot, and dead-band, and small deviations are tracked as a trend rather than discarded as noise.
Pattern Classification
The trend shape is matched against known signatures for sticking, drift, and hunting so the diagnosis points to a mechanism, not just an anomaly.
Ranked Work List
Reliability engineers get a prioritized list of valves and actuators by severity and trend velocity, tied directly to the affected loop.
A Trip Investigation Should Not Be the First Time Anyone Looks at Stroke History
iFactory keeps stroke, drift, and loop response visible continuously, so degradation shows up as a trend instead of a surprise.
What Operators Report Versus What Is Actually Happening at the Valve
| Reported Symptom | Likely Root Cause | Where iFactory Flags It First |
|---|---|---|
| Sluggish load ramp response | Valve stem friction or early-stage sticking | Widening dead-band on stroke response trend |
| Small load oscillation at steady state | Governor loop compensating for actuator drift | Increasing correction frequency in loop error trend |
| Valve position indicator disagrees with DCS command | Feedback sensor drift or hydraulic wear | Growing command-versus-feedback deviation |
| Unexplained trip during fast load change | Governor instability crossing a stability margin | Oscillation amplitude trend crossing threshold pre-trip |
What Reliability Teams Report After Adding Continuous Valve and Governor Diagnostics
Grid Operators Notice Slow Ramp Response Long Before Maintenance Sees a Work Order
Ancillary services and frequency response commitments depend on a turbine hitting its commanded ramp rate within a tight tolerance window, and a governor valve carrying even a small amount of stiction eats directly into that margin. The unit still technically follows the dispatch signal, but the response lags by a fraction of a second longer than it did a year ago, and that lag compounds every time the grid asks for a fast correction. Over time, a plant that was once a reliable fast-responder starts showing up on the operator's performance scorecard as inconsistent, and by the time anyone connects that pattern back to a specific valve, the sticking has usually progressed well past the point where a simple lubrication or seal replacement would have solved it.
This is why treating valve and actuator health as a continuous diagnostic problem, rather than a periodic inspection checklist, matters more for steam turbines than for almost any other rotating asset on site. The governor loop is not just a maintenance concern, it is a commercial one, and the earlier a degrading valve is caught, the smaller and cheaper the intervention needed to fix it.
iFactory Adds a Continuous Layer on Top of Periodic OEM Diagnostics
Turbine OEMs already provide diagnostic tools for governor systems, and most plants run a periodic health check as part of a maintenance contract or outage scope. iFactory is not designed to replace that relationship, it is designed to fill the gap between those periodic checks by watching the same command and feedback signals every hour of every day the unit runs. When an OEM diagnostic flags an issue during a scheduled review, iFactory's continuous trend often shows exactly when that issue started to develop, which turns a point-in-time finding into a documented history that helps justify the repair scope and timing.
For plants running multiple turbine units or multiple sites, this continuous layer also makes it possible to compare valve and governor health across the fleet in one place, instead of relying on separate OEM reports generated on different schedules for each unit.
Questions Reliability Engineers Ask About Turbine Valve and Governor Diagnostics
Most Plants Start With the Governor Valves Tied to the Highest-Value Load Response Commitments
A typical rollout begins by connecting to the historized DCS tags already available for the main governor and control valves, since no new field instrumentation is usually required to establish a first baseline. The initial baseline period runs long enough to capture a representative range of load conditions, including fast ramps and steady-state holds, so the diagnostic understands what healthy behavior actually looks like for that specific unit rather than applying a generic threshold. From there, coverage typically expands to extraction valves, bypass valves, and any secondary actuators that feed into the same governor loop, giving the reliability team a complete picture of everything that influences load response on a given turbine.
Plants running multiple units usually bring a second and third turbine online within a few weeks of the first, once the initial baseline and classification logic have been validated against known maintenance history, which shortens the time it takes to extend coverage across the full fleet.
Stop Waiting for a Trip to Tell You a Valve Was Already Drifting
iFactory turns command-versus-feedback data you already collect into an early, ranked signal for valve, actuator, and governor health.